Figure 2.

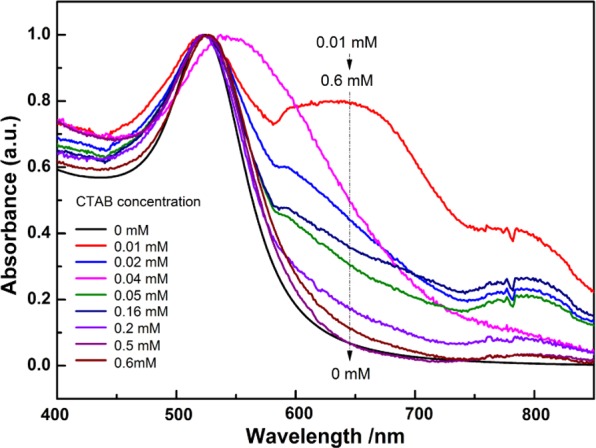
Change in the UV–vis spectra with different concentrations of CTAB (<CMC) for the mixture of CTAB and a given amount of AuNPs (3 × 10¹⁰ NPs/mL).

Change in the UV–vis spectra with different concentrations of CTAB (<CMC) for the mixture of CTAB and a given amount of AuNPs (3 × 10¹⁰ NPs/mL).