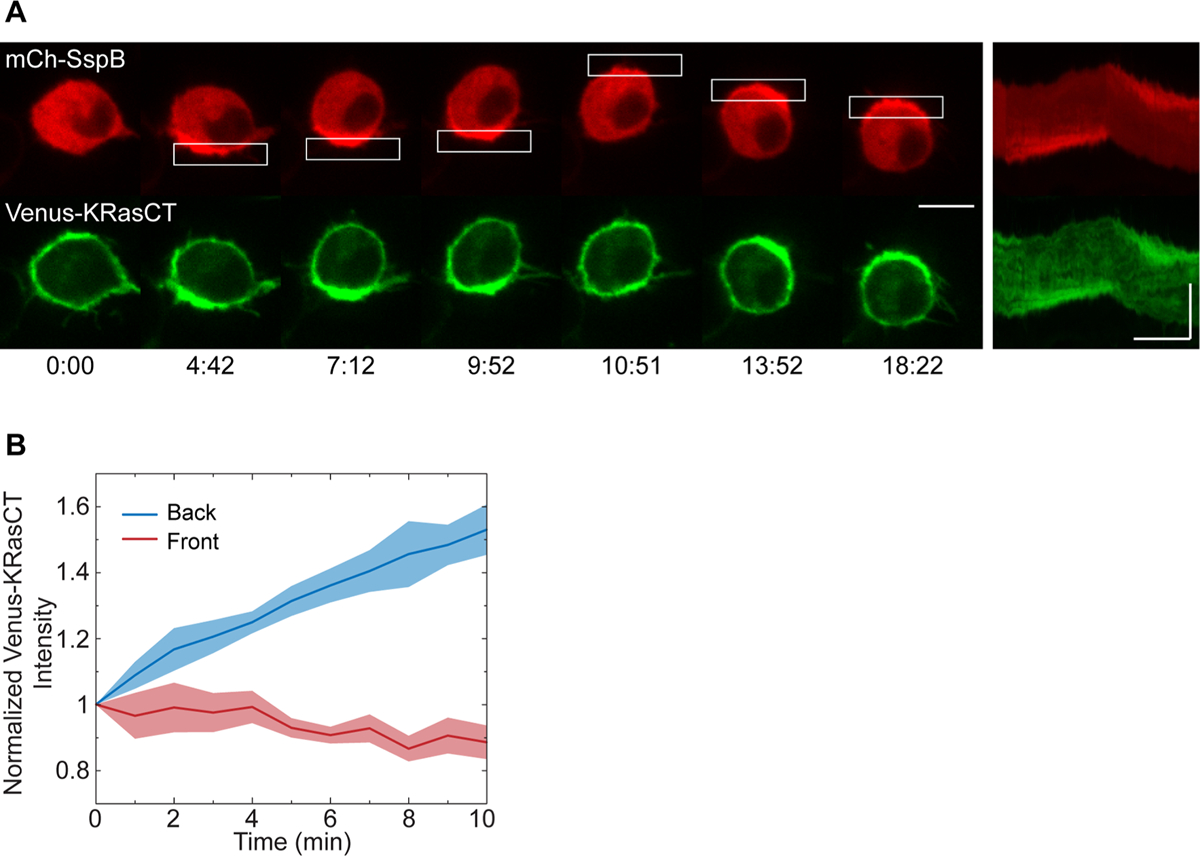
Figure 2.

Plasma membrane dynamics during protein accumulation-driven migration. (A) Localization of plasma membrane lipids during protein accumulation-driven migration. Cell is transfected with mCh-SspB (red), iLID-KRasCT, and plasma membrane marker Venus-KRasCT (green). Kymographs are shown on the right. Rectangle represents the area of photoactivation. Image sequence scale bar is 10 μm. Kymograph scale bars are 10 μm (vertical) and 5 min (horizontal). Time is in min:sec. (B) Normalized intensity of Venus-KRasCT in the back half (blue curve) and front half (red curve) of migrating cells transfected with mCh-SspB, iLID-KRasCT, and Venus-KRasCT. Solid lines represent the mean and shaded regions are SEM. Migration was initiated at t = 0. n = 6.
