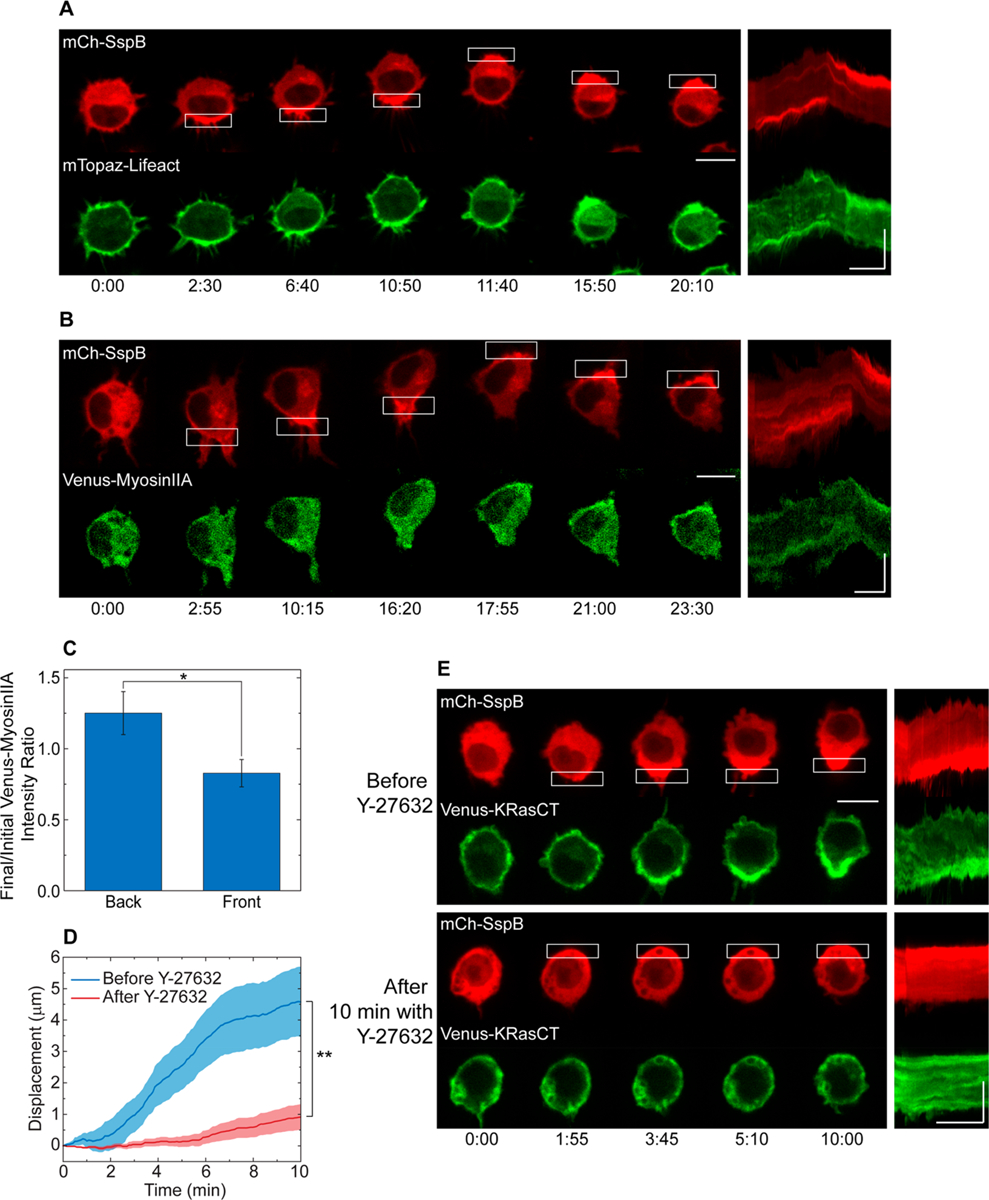
Figure 3.

Dynamics of cytoskeletal proteins during protein accumulation-driven migration. (A) Distribution of F-actin. Cell is transfected with mCh-SspB (red), iLID-KRasCT, and F-actin marker mTopaz-Lifeact (green). (B) Distribution of myosinIIA. Cell is transfected with mCh-SspB (red), iLID-KRasCT, and Venus-myosinIIA (green). (C) Change in myosinIIA distribution in the back and front of cells transfected with mCh-SspB, iLID-KRasCT, and Venus-myosinIIA during protein accumulation-driven migration. Y-axis is the ratio of Venus-myosinIIA intensity at t = 10 min and t = 0. Migration was initiated at t = 1 min. Error bars are SEM. n = 8. (D) Speed of cells undergoing protein accumulation-driven migration before and after 30–45 min incubation with 100 μM Y-27632. Solid lines represent the mean and shaded regions are SEM. n = 11. (E) Representative cell from (D). Cell is transfected with mCh-SspB (red), iLID-KRasCT, and Venus-KRasCT (green). Kymographs are shown on the right of the image sequences. Rectangle represents the area of photoactivation. Image sequence scale bar is 10 μm. Kymograph scale bars are 10 μm (vertical) and 5 min (horizontal). Time is in min:sec. *p < 0.05, two-sample t test. **p < 0.01, paired t test.
