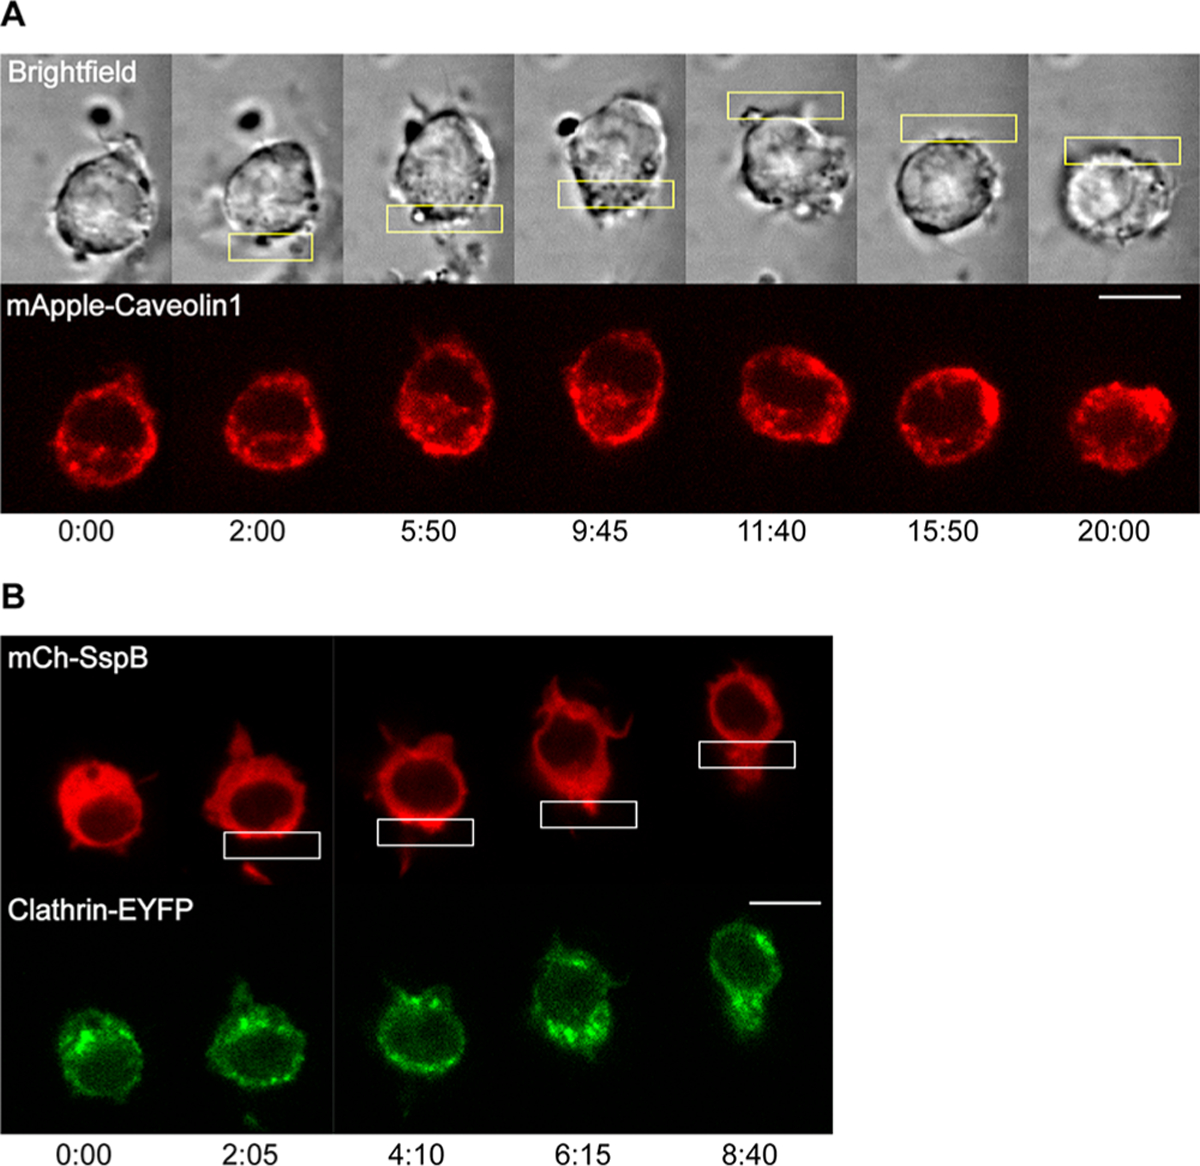
Figure 4.

Localization of tension- and curvature-sensing endocytosis proteins during protein accumulation-driven migration. (A) Distribution of caveolin. Cell is transfected with mTurq-SspB, iLID-KRasCT, Venus-KRasCT, and mApple-caveolin1 (red). Caveolin increased at the photoactivated side in 7 out of 9 cells. (B) Distribution of clathrin. Cell is transfected with mCh-SspB (red), iLID-KRasCT, and Clathrin-EYFP (green). Clathrin increased at the photoactivated side in 7 out of 8 cells. Rectangle represents the area of photoactivation. Scale bar is 10 μm. Time is in min:sec.
