Figure 8.

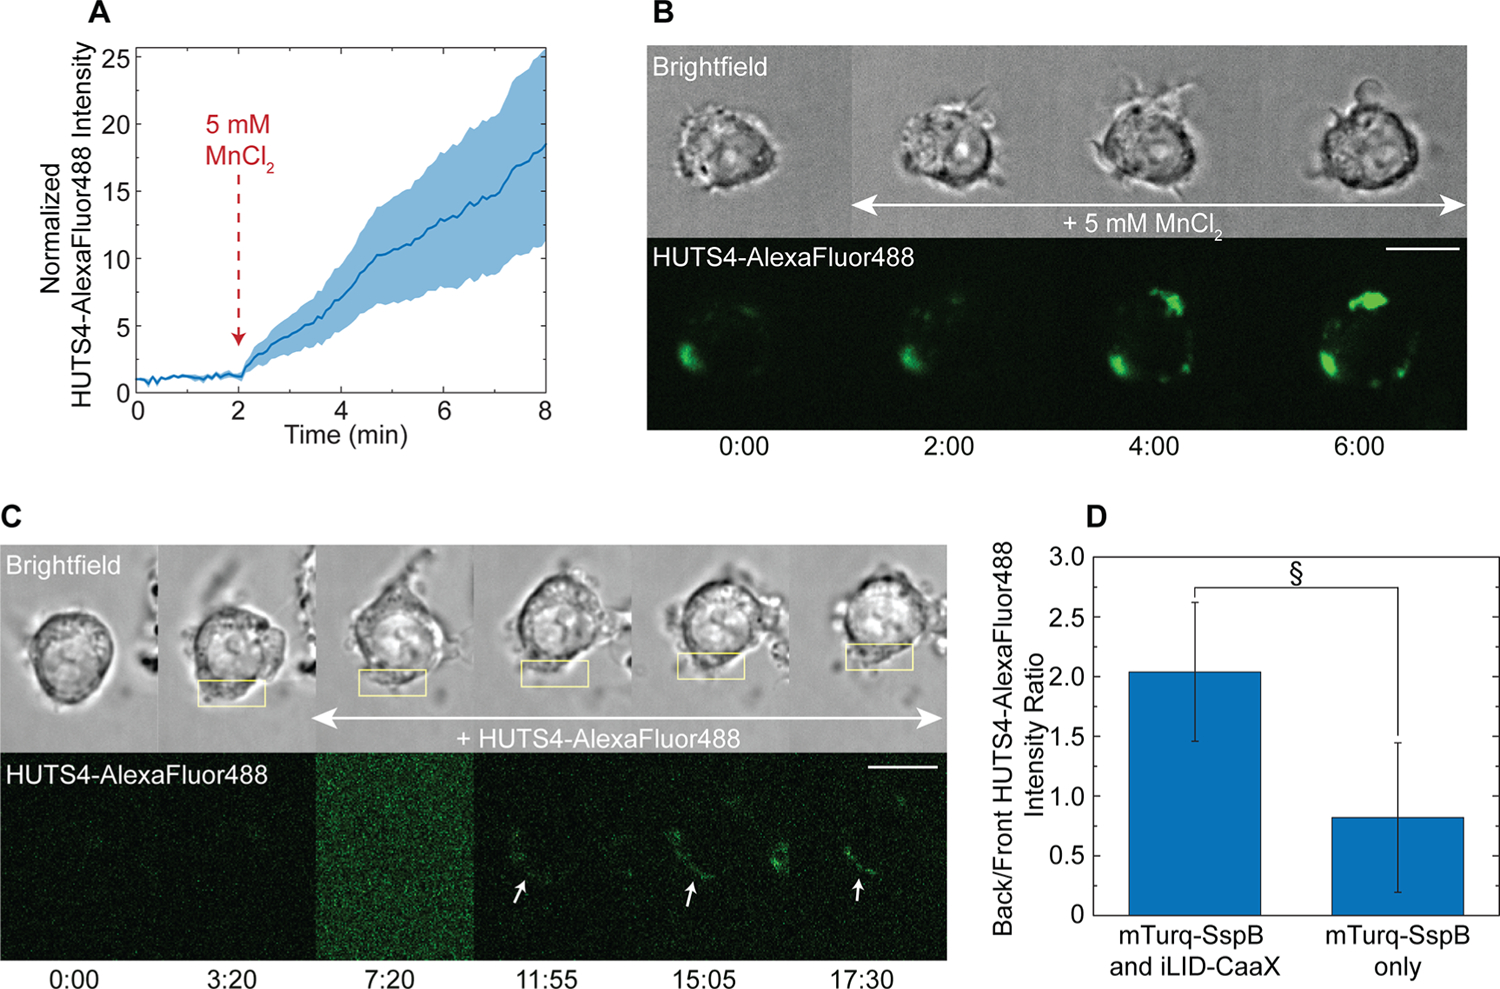
Integrin β1 activity in a cell migrating due to polarized protein accumulation. (A) Integrin β1 activity sensing with HUTS4-AlexaFluor488. Fluorescence intensity at the plasma membrane was measured over 8 min. Five mM MnCl2 was added at t = 2 min to induce integrin activation. Solid line represents the mean and shaded regions are SEM. n = 5. (B) Representative cell from (A). (C) Activation of integrin β1 during protein accumulation-driven migration. Cell is transfected with mTurq-SspB, iLID-KRasCT, and mCh-integrinβ1. Migration was initiated at t = 1:00, and HUTS4-AlexaFluor488 (green) was added to the dish at t = 7:20. HUTS4 bound to the photoactivated side in 9 out of 10 cells where polarized binding was observed. Rectangle represents the area of photoactivation. Scale bar is 10 μm. Time is in min:sec. (D) Polarization of integrin β1 activity in cells after 17 min of polarized photoactivation in the presence of HUTS4-AlexaFluor488. Cells were transfected with mCh-integrinβ1 and mTurq-SspB with iLID-KRasCT (left, n = 13) or mTurq-SspB alone as control (right, n = 11). Error bars are SEM. §p = 0.089, two-sample t test.
