Figure 9.

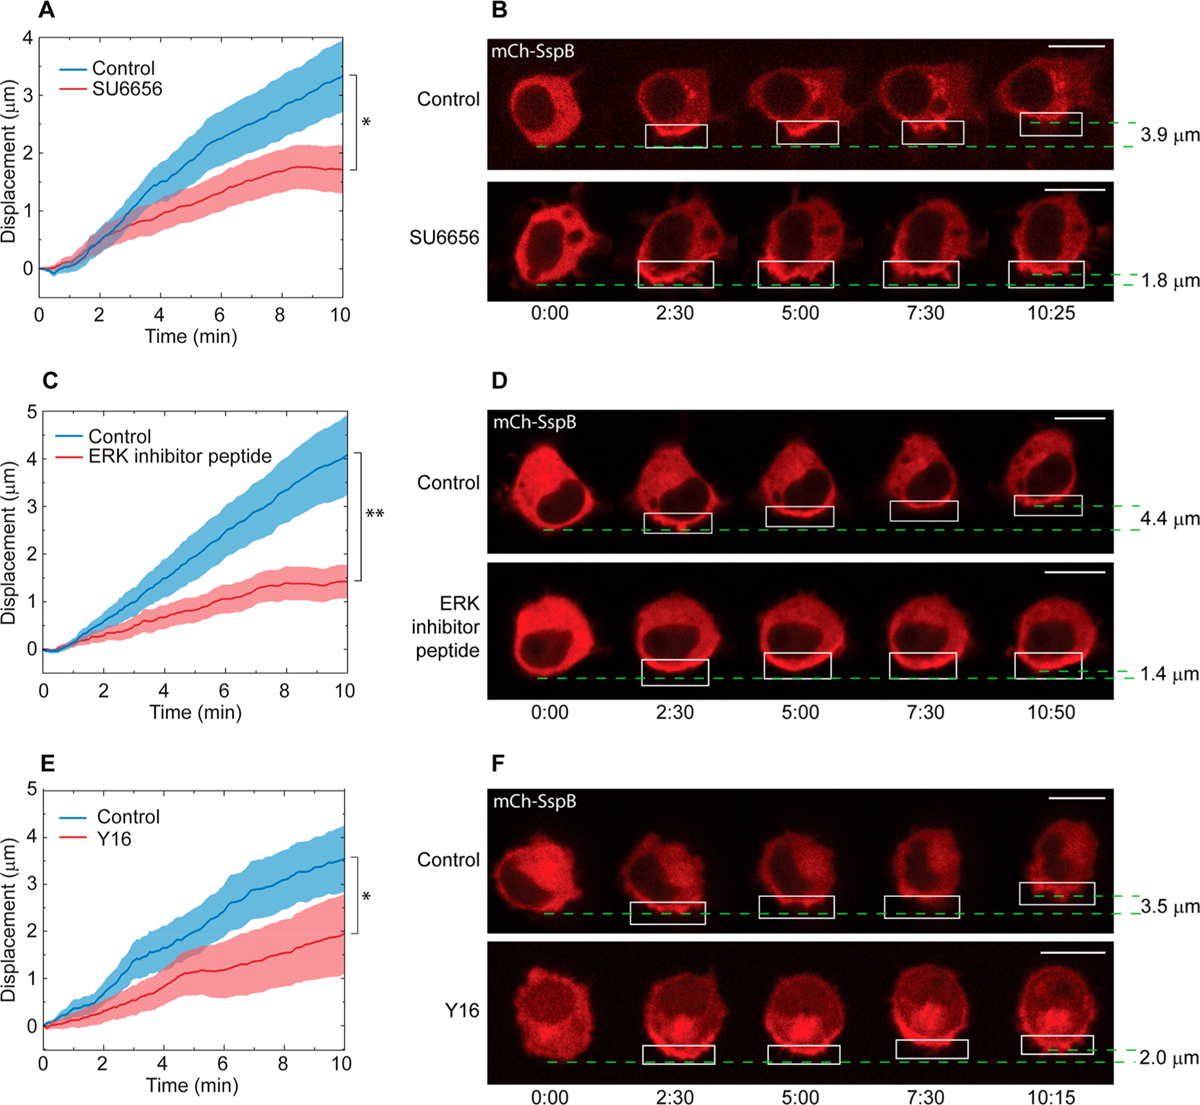
Effect of pharmacological perturbations of proteins upstream of RhoA activation on protein accumulation-driven migration. (A) Inhibition of SFK. Cells were incubated for 30–45 min with 50 μM SU6656 (red curve, n = 19) or DMSO (blue curve, n = 21) before imaging. (B) Representative cell from (A). (C) Inhibition of ERK. Cells were incubated for 30–45 min with 30 μM ERK inhibitor peptide (red curve, n = 11) or H2O (blue curve, n = 12) before imaging. (D) Representative cell from (C). (E) Inhibition of LARG. Cells were incubated for 30–45 min with 25 μM Y16 (red curve, n = 14) or DMSO (blue curve, n = 11) before imaging. (F) Representative cell from (E). Solid lines represent the mean and shaded regions are SEM. All cells were transfected with mCh-SspB, iLID-KRasCT, and Venus-KRasCT. Dashed green lines designate starting and ending position of the cell rear and are used to calculate the cell displacement. Rectangle represents the area of photoactivation. Scale bars are 10 μm. Time is in min:sec. *p < 0.05, **p < 0.01, two-sample t test.
