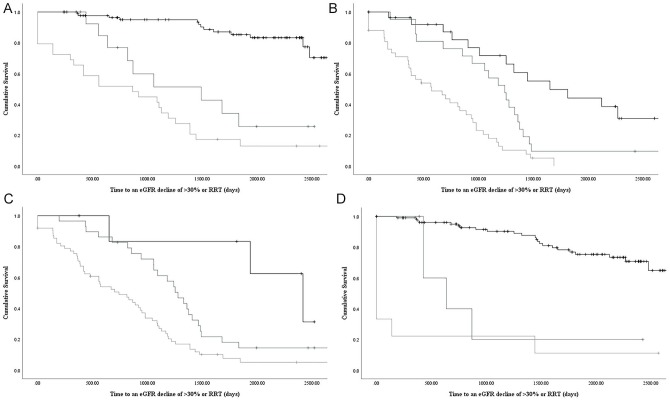
Figure 2.
Kaplan-Meier survival curves for time to an eGFR decline of > 30% or renal replacement therapy by KFRE risk (>5% black, 1-5% dark grey, <1% light grey) for the following strata: A. TKV<1000cm3, B. TKV > 1000 cm3, C. baseline eGFR <50 ml/min, D. baseline eGFR > 50 ml/min; p values < 0.0001 by log rank test for all.
Note. eGFR = estimated glomerular filtration rate; RRT = renal replacement therapy.

