Figures 1–4.
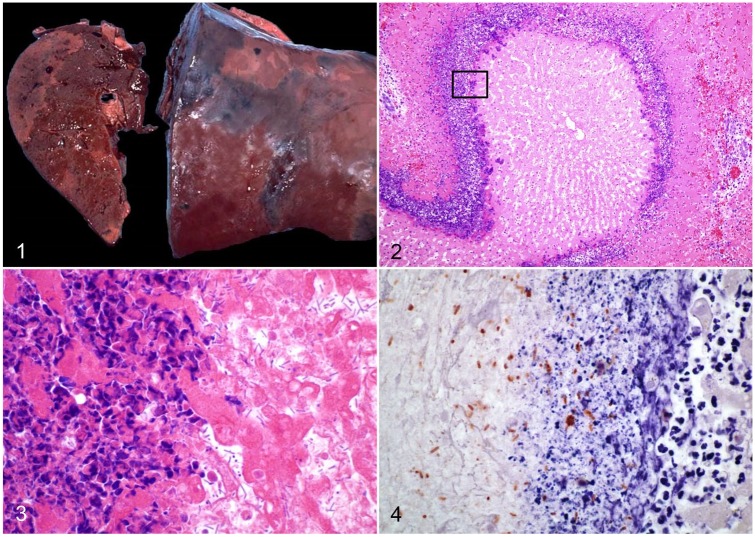
Infectious necrotic hepatitis. Figure 1. Multiple, well-demarcated, randomly distributed, pale foci of necrosis in an ovine liver. Reproduced with permission from Navarro and Uzal, 2016.44 Figure 2. Large focus of coagulative necrosis in an equine liver, with an inflammatory cell rim. H&E. Figure 3. Higher amplification of the boxed area in Fig. 2. Large numbers of rod-shaped bacteria at the periphery of the necrotic area (at right), with a contiguous leukocytic infiltrate of viable and degenerate neutrophils (at left). H&E. Figure 4. Numerous immunopositive Clostridium novyi at the periphery of a necrotic hepatic focus. Indirect immunoperoxidase staining, as described in Nyaoke et al. 2018.48

