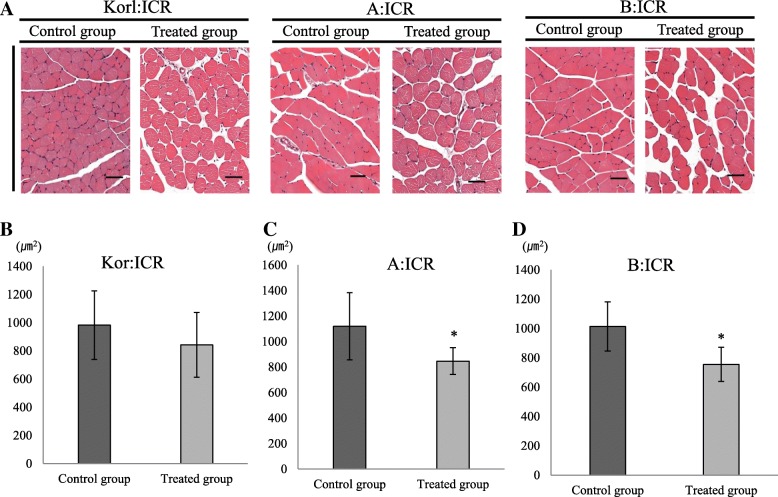
Fig. 3.
Histopathology analysis following BoNT/A muscle injection in ICR mice from three different sources. a H&E staining of mice muscle. Scale bar = 50 μm. b–d Muscle size was compared between the negative control and BoNT/A treated groups. *Significantly different compared to the negative control group (*p < 0.05). The data represent the mean ± SD of three replicates

