Fig. 2.
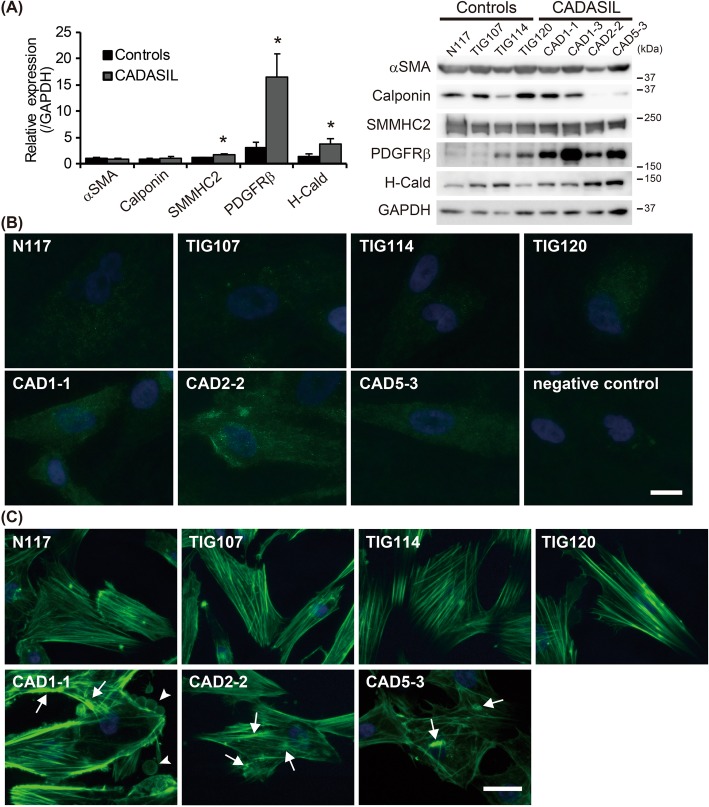
Recapitulation of CADASIL phenotypes. a Western blotting analysis of VSMC markers revealed significantly upregulated PDGFRβ, SMMHC2 and H-caldesmon (H-Cald) in CADASIL MCs (n = 3) compared to control (n = 4). b shows representative images of the increased PDGFRβ in CADASIL. c Actin cytoskeleton in CADASIL MCs was often irregular and unevenly distributed, forming aggregation, or nodes (arrows). Occasionally, the cells showed a ‘bleb’-like structure on the surface (arrowheads), which was rarely present in controls. Bars represent 10 μm in (b) and 25 μm in (c). The error bars represent the SEM. *p < 0.05

