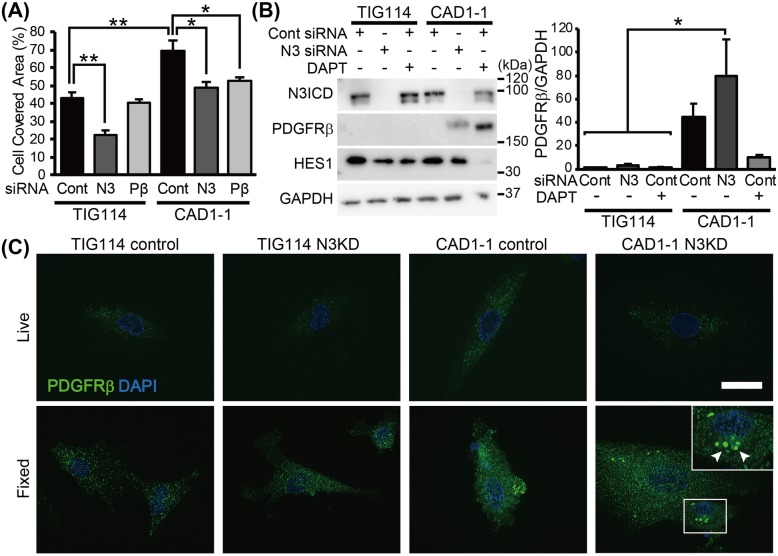
Fig. 5.
Relationships between NOTCH3, PDGFRβ and migration. a Cell covered area was measured at 9 h after the start of migration assay. Both NOTCH3 and PDGFRB knockdown resulted in the reduced migration rate in CADASIL iPSMCs (CAD1–1 N3 and Pβ) to the control level (TIG114 Cont). However, NOTCH3 knockdown resulted in further increase of PDGFRβ in CADASIL, while inhibition of DAPT treatment significantly reduced expression (b). c Immunofluorescent staining of PDGFRβ revealed increased surface and cytoplasmic PDGFRβ in CADASIL MCs (CAD1–1 control, Live and Fixed). Further increase of PDGFRβ by NOTCH3 siRNA transfection (N3KD) was explained by the intracellular aggregation of excessive PDGFRβ (arrowheads) and reduced functional receptors on the plasma membrane (CAD1–1 N3KD, fixed). Bar represents 20 μm. The error bars represent the SEM. *p < 0.05, **p < 0.01

