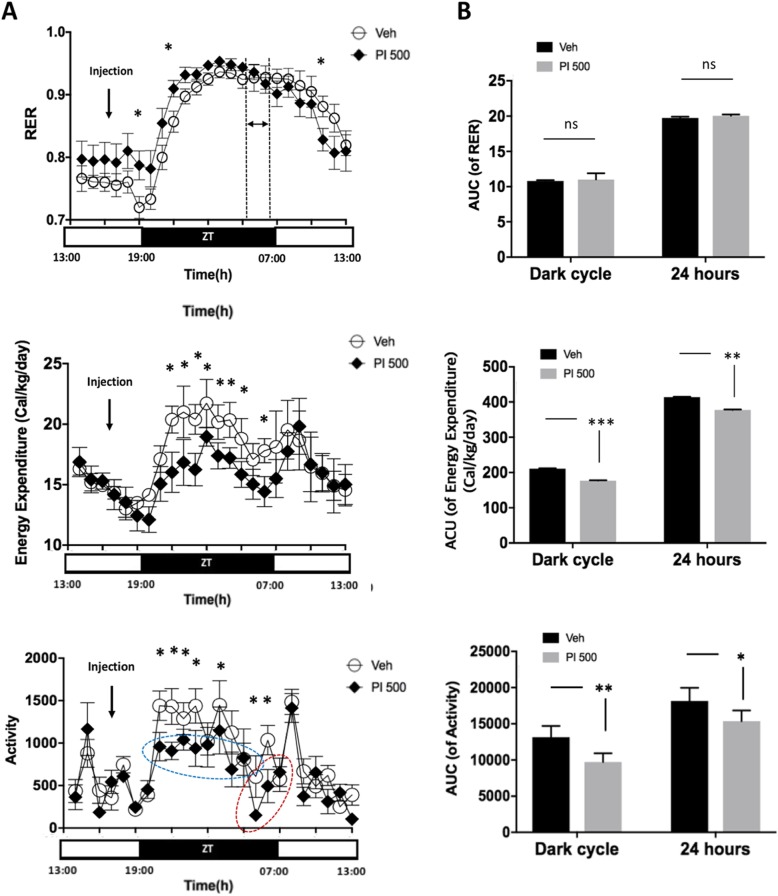
Fig. 3.
Real-time changes in RER, EE and activity over 24 h by light cycles between Veh- and PI 500-treated animals. a Real-time change tracking of RER, EE and activity over 24 h in mice treated with vehicle and PI extract. b The area under curve (AUC) demonstrated by bar graphs during dark cycle and 24 h in RER, EE and activity in Veh and PI 500 mice. The vehicle and PI extract were administered orally 2 h before lights- off. EE and activity showed statistical significance between the groups. The error bar represents mean ± standard error (SE). ZT stands for zeitgeber time. (***, P < 0.0005; **, P < 0.005; *, P < 0.05; ns, non-significant)

