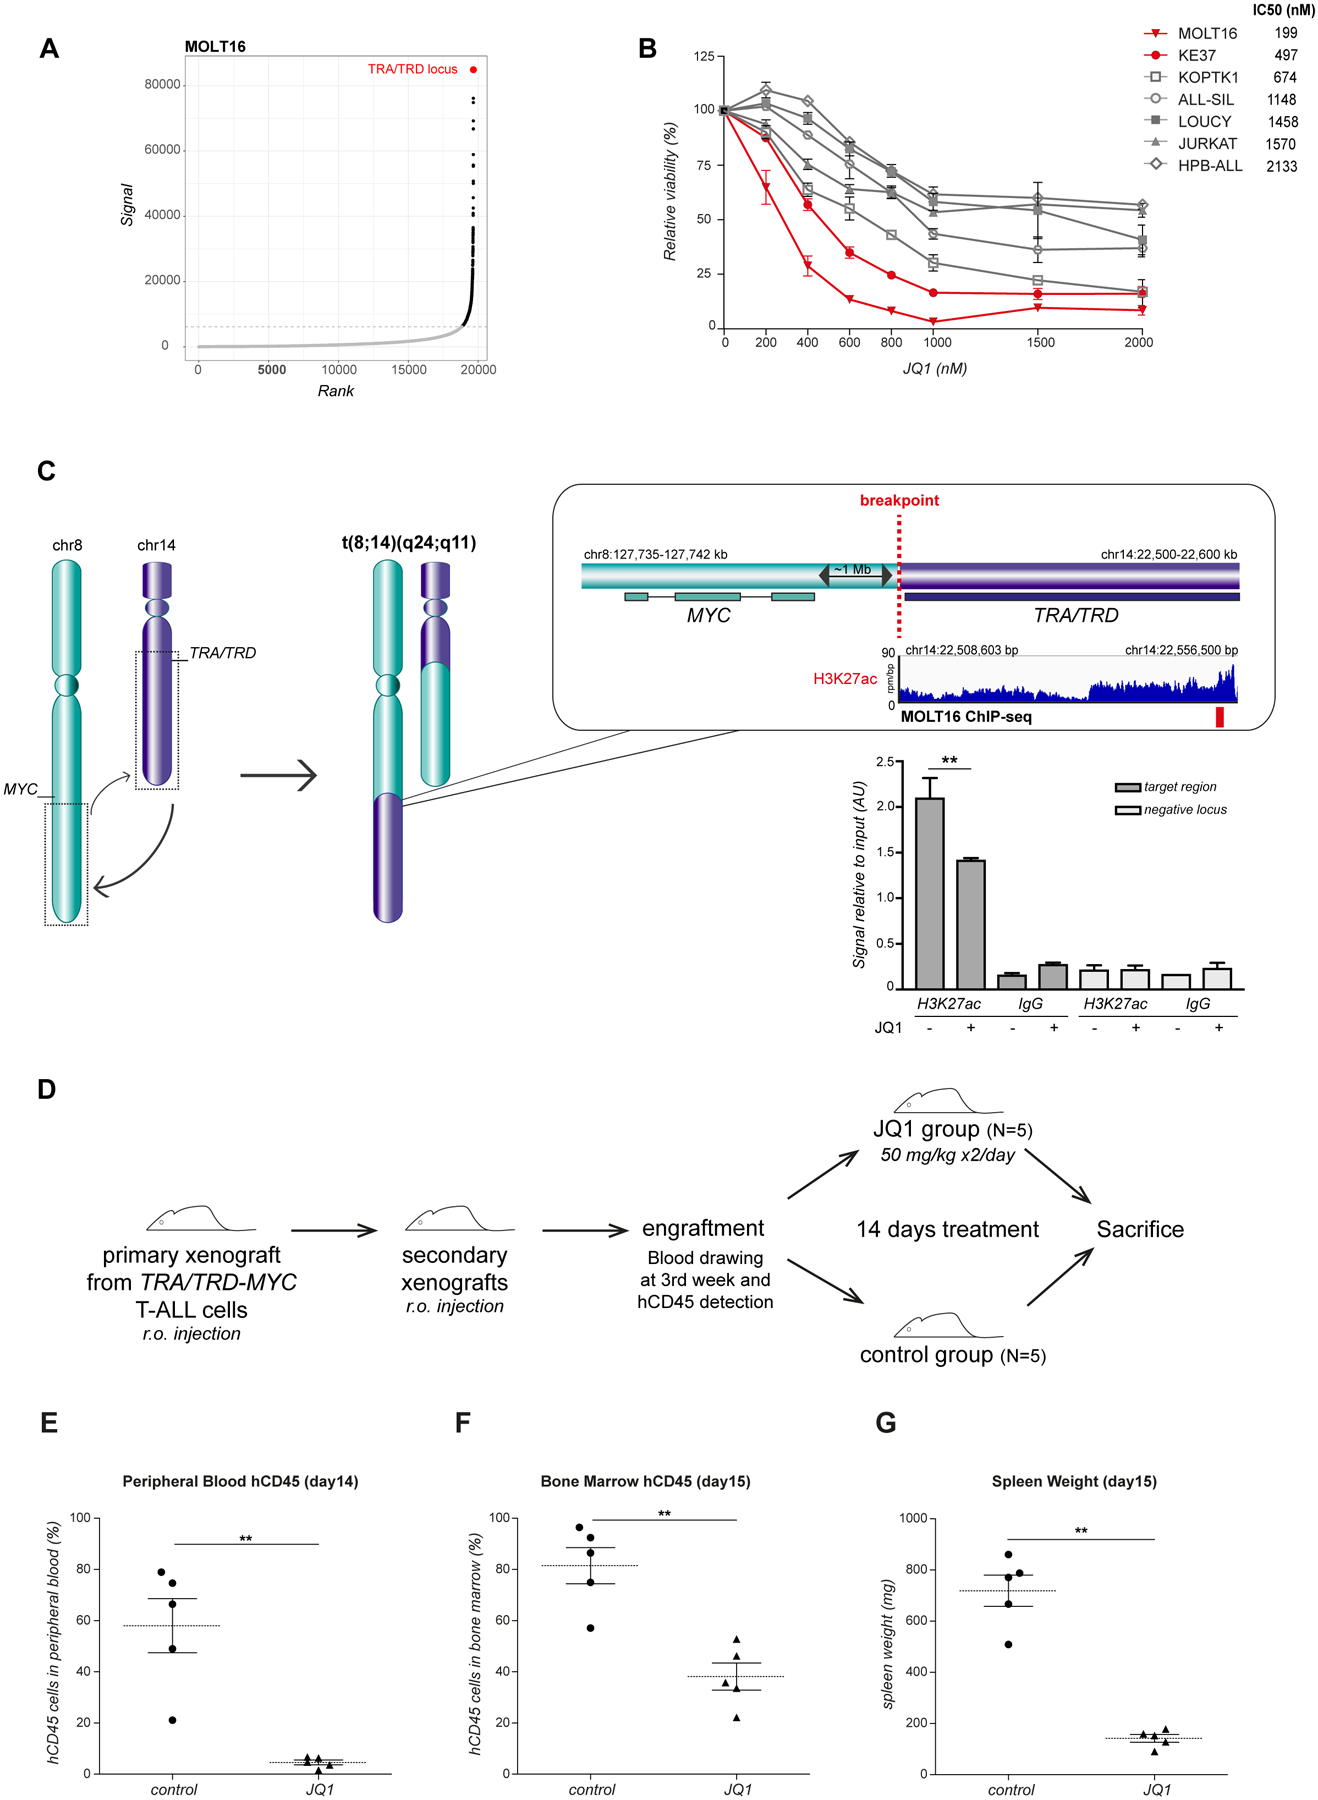
Figure 2. BET bromodomain inhibition in t(8;14)(q24;q11) positive T-ALL.

(A) Hockey-stick plot representing the normalized rank and signal of H3K27ac peaks in t(8;14)(q24;q11) positive MOLT16 cells. TRA/TRD enhancer elements (in red) showed the highest level of H3K27ac. (B) Cell viability in a panel of human T-ALL cell lines after 72 hours of JQ1 treatment, relative to control cells treated with dimethylsulfoxide. TRA/TRD-MYC rearranged T-ALL cell lines are represented in red. Average and standard deviation of 3 independent experiments are plotted. IC50 values (nM) are reported for each cell line. (C) Schematic representation of the t(8;14)(q24;q11) translocation, H3K27ac ChIP sequencing tracks at TRA/TRD locus in MOLT16 cell line and H3K27ac levels after JQ1 treatment (7 hours, 2μM) as evaluated by ChIP qPCR analysis. Primers used were designed on putative TRA/TRD enhancer regions (H3K27ac positive targets, red bar). Signal enrichment at target regions is reported in H3K27ac and IgG ChIP vs. relative inputs. Negative regions downstream of the positive target were analyzed as control (chr14:22,626,300–22,626,420). Means were calculated on 4 replicates with standard deviation represented by the error bars (**P<0.01). (D) JQ1 in vivo treatment experimental design. NSG mice were retro-orbital injected with TRA/TRD-MYC translocated cells from T-ALL patient (case 4, see Table S1) to generate primary xenografts. After leukemia engraftment, blasts were isolated from primary models and injected in other NSG mice to obtain a larger cohort of secondary xenografts for treatment. hCD45 positivity was checked from peripheral blood after 3 weeks. Upon engraftment, JQ1 was intraperitoneally administered twice/day for 14 days (50mg/kg bodyweight). Vehicle was administered to the control group following the same schedule. At the end of the experiment, animals were sacrificed and tissues analyzed. (E) Percentage of hCD45 leukemic cells in peripheral blood of NSG mice xenotransplanted with TRA/TRD-MYC T-ALL cells after 14 days of JQ1 treatment vs. DMSO. (F) Percentage of hCD45 leukemic cells in the bone marrow at the end of the experiment (day 15). (G) Xenografts spleen weight (mg) after 14 days of JQ1 treatment vs. DMSO. Mann–Whitney test was used to compare the treatment groups (**P<0.01). Horizontal lines on the graph indicate the median for each group.
