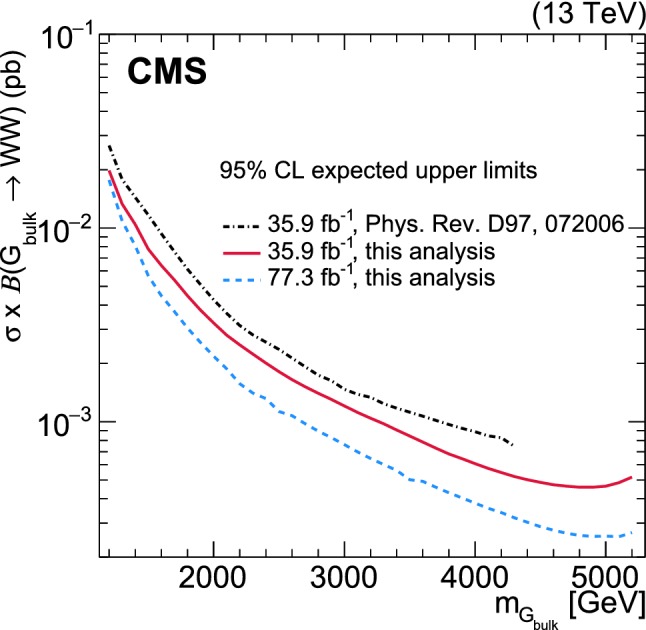
Fig. 13.

Expected 95% upper limits on the product of the production cross section () and the branching fraction for a signal using 35.9 of data collected in 2016 obtained using the multi-dimensional fit method presented here (red solid line), compared to the result obtained with previous methods (black dash-dotted line) [29]. The final limit obtained when combining data collected in 2016 and 2017 is also shown (blue dashed line)
