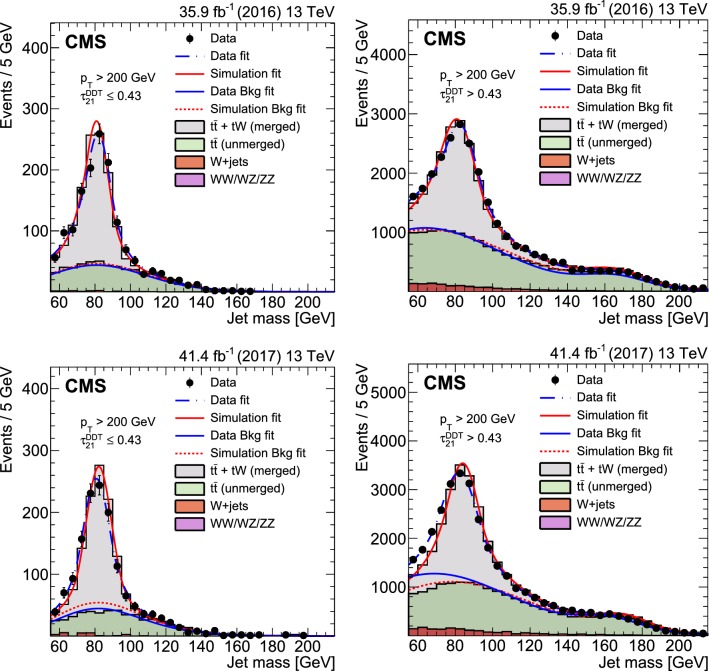
Fig. 5.
The jet mass distribution for events that pass (left) and fail (right) the selection in the control sample. The results of the separate fits to data and to simulation are shown by the dash-dotted blue and solid red lines, respectively. The background components of the fits are shown as dashed and dash-dotted lines. The fit to 2016 data is shown in the upper panels and the fit to 2017 data in the lower panels. The associated uncertainties are shown in Table 1 and discussed further in Sect. 4.4

