
Fig. 7.
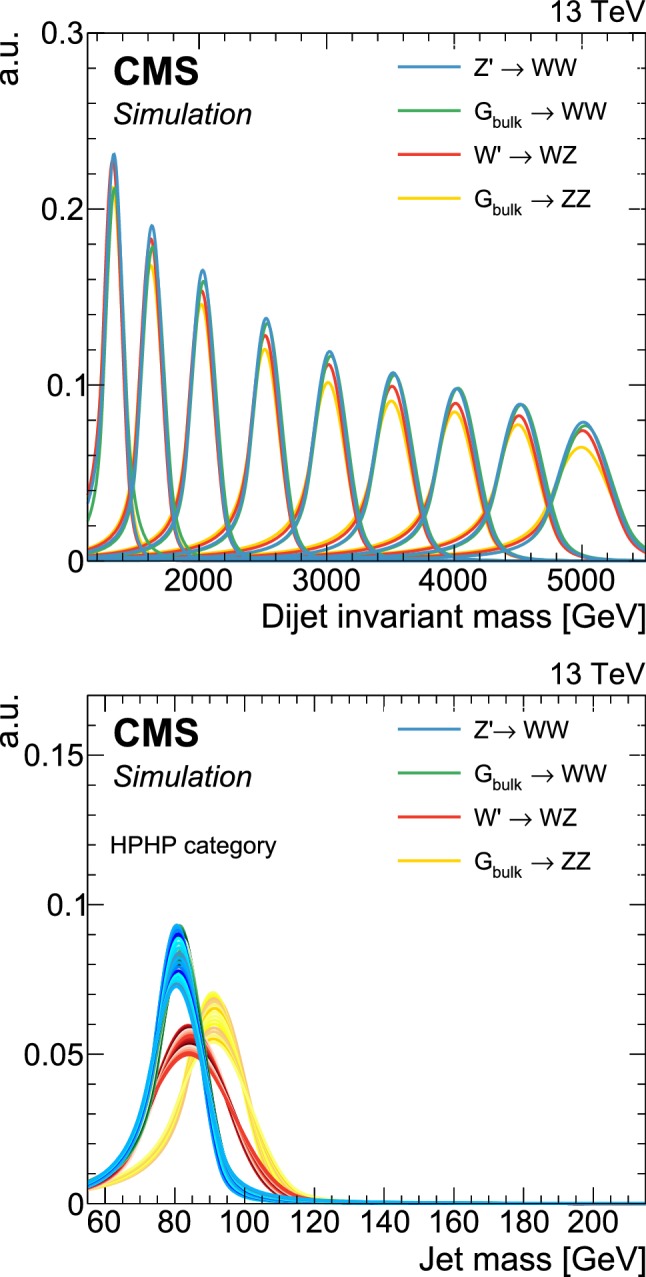
The final (upper) and (lower) signal shapes extracted from the parameterization of the dCB function. The same shapes are used for both purity categories. The jet mass distributions are shown for a range of resonance masses between 1.2 and 5.2 for one of the two jets in the events in the HPHP category. Because the jets are labelled randomly, the jet mass distributions for the second jet are essentially the same as the one shown. The distributions for a decaying to have the same shapes as those for the signal and are therefore not visible