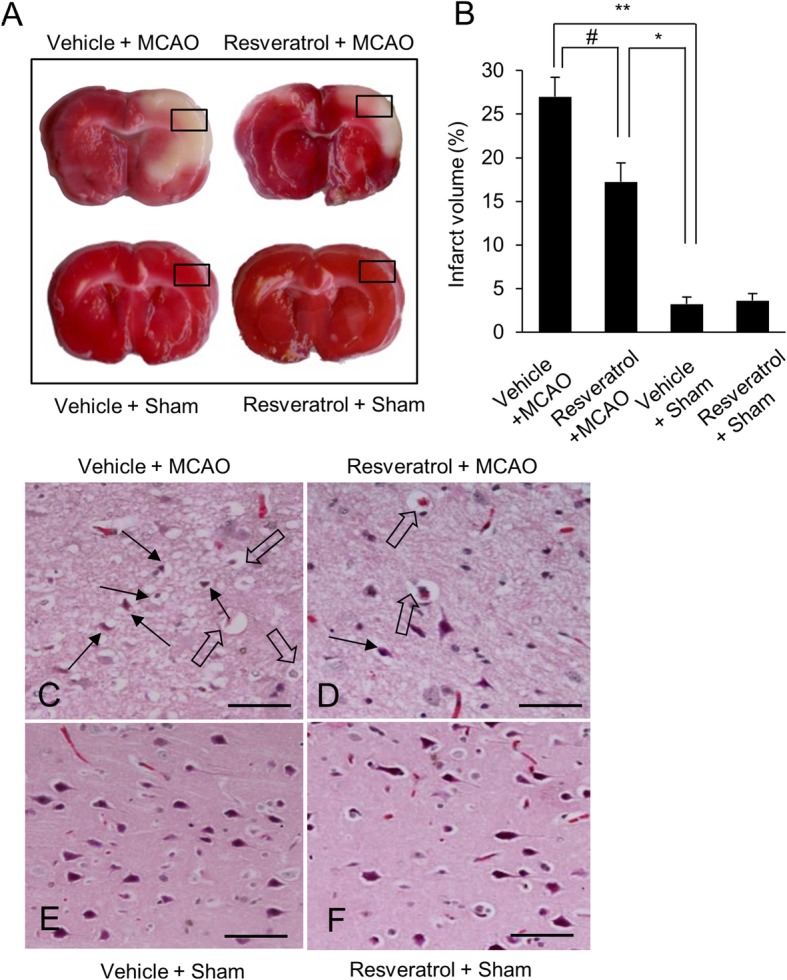
Fig. 2.

Representative photograph of TTC staining (a), infarct volume (b), and hematoxylin and eosin staining (c-f) in cerebral cortex of vehicle + sham, resveratrol + sham, vehicle + middle cerebral artery occlusion (MCAO), and resveratrol + MCAO animals. Infarct volume was calculated by ratio of infarction area to total area. Resveratrol attenuated the MCAO-induced infarct region. C-F photos indicate the square areas of A. Arrows indicate shrunken and condensed nuclei and open arrows indicate swelled and vacuolated forms. Scale bar = 100 μm. Data (n = 4) are represented as the mean ± S.E.M. * p < 0.01, ** p < 0.05 vs. vehicle + sham animals, # p < 0.05 vs. vehicle + MCAO animals
