
Fig. 3.
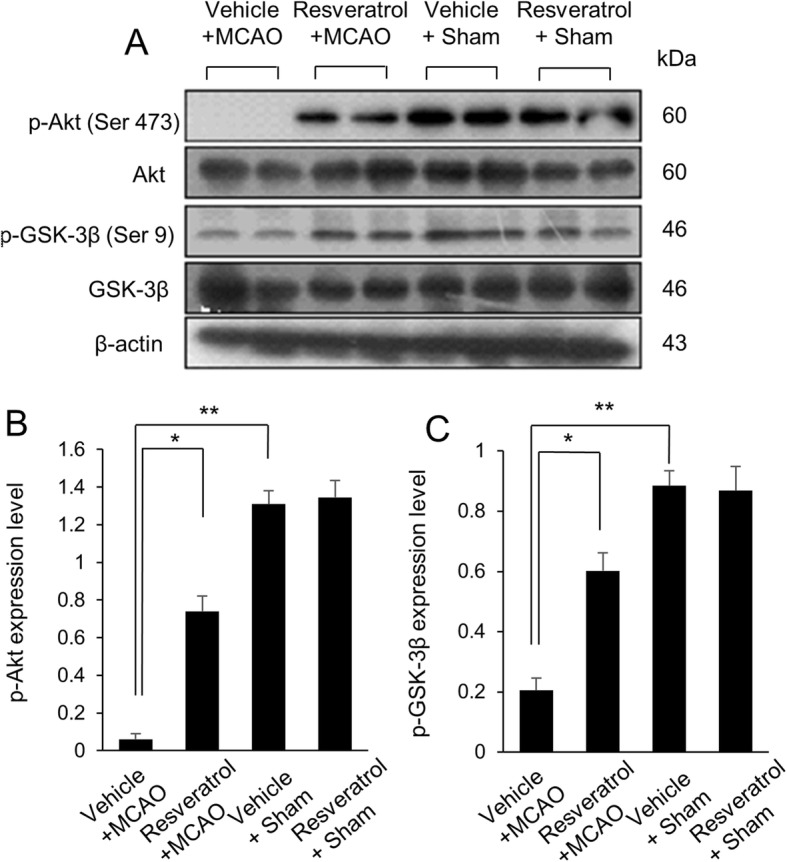
Western blot analysis of phospho-Akt and phospho-GSK-3β in cerebral cortex of vehicle + sham, resveratrol + sham, vehicle + middle cerebral artery occlusion (MCAO), and resveratrol + MCAO animals (a). Densitometric analysis is represented as a ratio of phospho-Akt (b) and phospho-GSK-3β (c) intensity to β-actin intensity. Data (n = 4) are shown as the mean ± S.E.M. * p < 0.01, ** p < 0.05 vs. vehicle + sham animals, # p < 0.05 vs. vehicle + MCAO animals