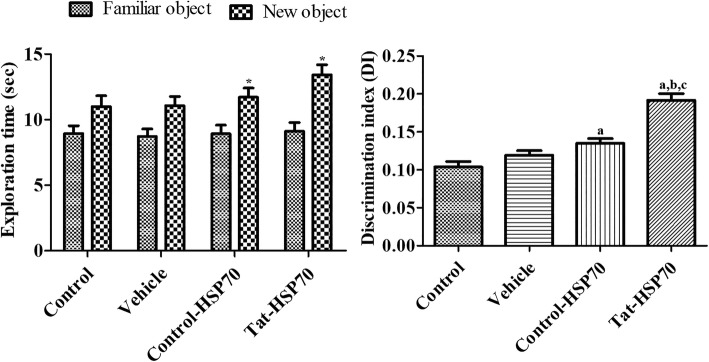
Fig. 2.
Exploration time (n = 10 per group; *p < 0.05, significant difference between familiar and novel objects) and discrimination index (n = 10 per group; aP < 0.05, versus control group; bP < 0.05, versus vehicle-treated group; cP < 0.05, versus control-HSP70 treated group) of familiar vs. novel objects during a novel object recognition test in control, vehicle-, control-HSP70-, and Tat-HSP70-treated mice. Data of the exploration time for each object (same object, where one object was replaced by a new one on the testing day) are presented as a percentage of total exploration time. All data are shown as % exploration time ± SEM

