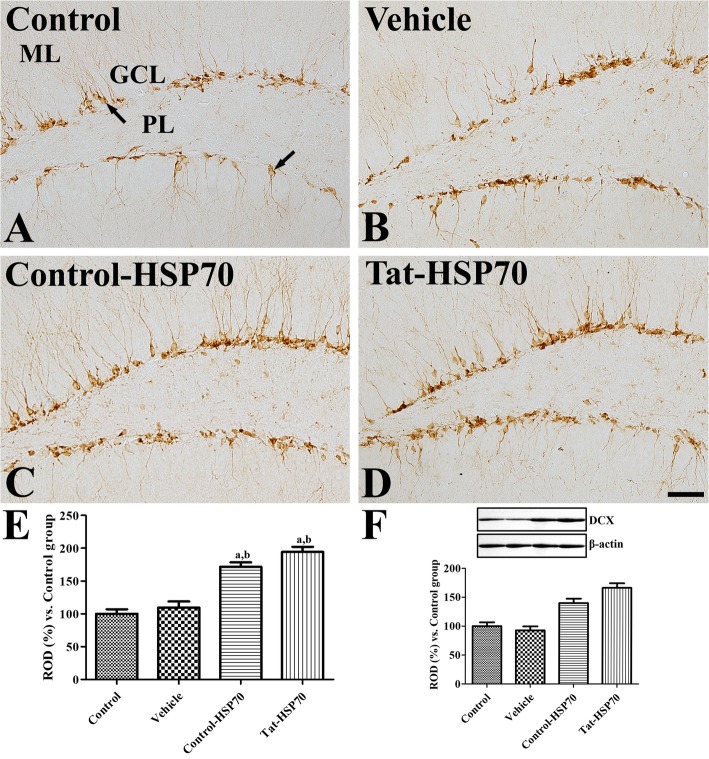
Fig. 4.
Immunohistochemistry for DCX in the dentate gyrus of control (a), vehicle- (b), control-HSP70- (c), and Tat-HSP70-treated (d) mice. In all groups, DCX-immunoreactive neuroblasts (arrows) are found in the dentate gyrus with dendrites. Note that DCX-immunoreactive neuroblasts shows delicate dendritic tree branching in the dentate gyrus of control-HSP70- and Tat-HSP70-treated mice. GCL, granule cell layer; ML, molecular layer; PL, polymorphic layer. Scale bar = 50 μm. e The relative optical densities (RODs) expressed as a percentage of the value representing the DCX immunoreactivity in the dentate gyrus of the control group are shown. f Values from western blot analysis is expressed as a ratio of DCX and β-actin immunoblot band in control group (n = 5 per group; aP < 0.05, versus control group; bP < 0.05, versus vehicle-treated group). Data are presented as mean ± SEM

