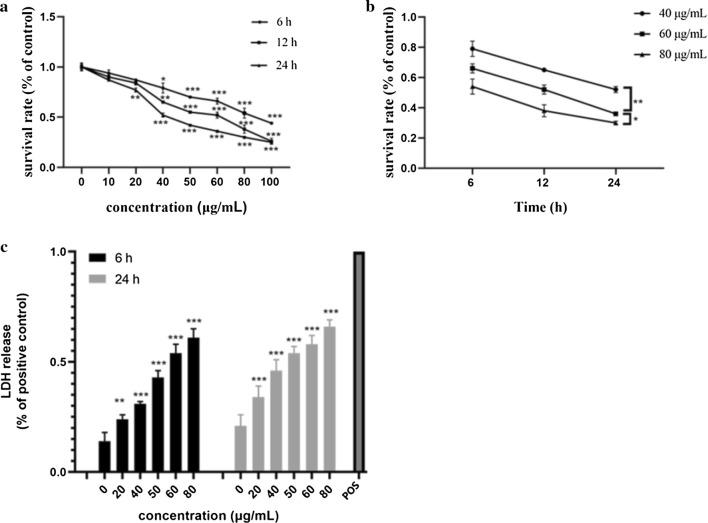
Fig. 2.
Concentration- and time-dependent cytotoxicity of GO in F98 cells. a, b Cells were exposed to GO at different concentrations (10, 20, 40, 50, 60, 80 and 100 µg/mL) for different amounts of time (6 h, 12 h and 24 h), and cell viability was assayed by CCK-8 assay. c Detection of LDH release in F98 cells treated with different concentrations of GO (20, 40, 50, 60 and 80 µg/mL) for 6 h and 24 h. The positive control (POS) corresponded to 100% LDH release. All data are expressed as the mean ± standard deviation (SD) of three independent experiments. *p < 0.05, **p < 0.01 and ***p < 0.001 vs. the control group

