Fig. 4.
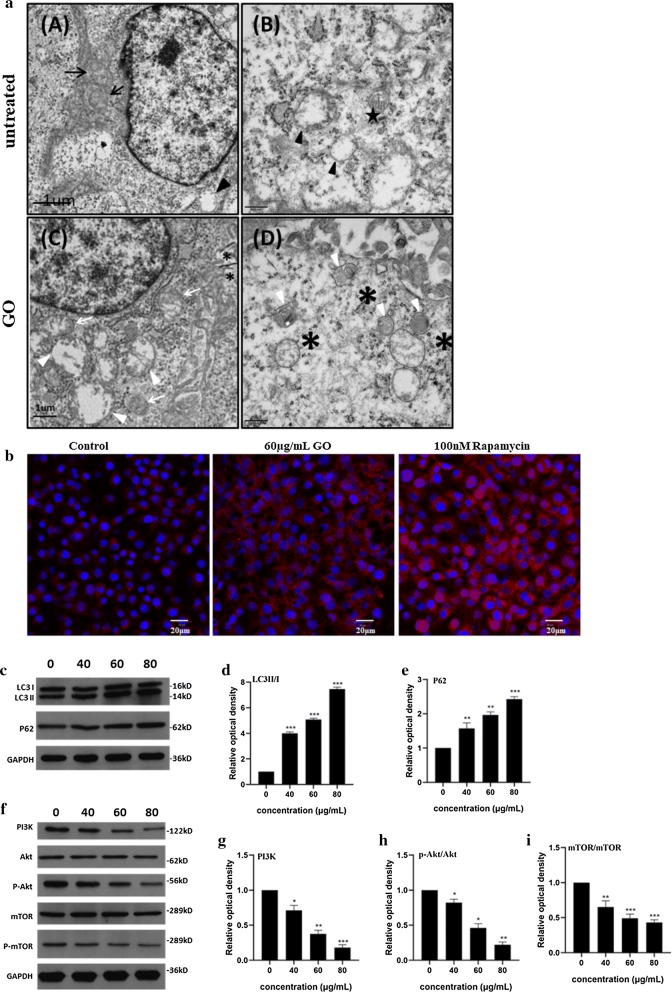
Go triggers autophagy in F98 cells. a Identification of TEM imagines of F98 cells after treated with GO at the concentration of 60 µg/mL for 24 h. Black arrowhead and black arrow indicate autophagosome and mitochondria, respectively. Black pentagon indicates initial autophagic vacuoles (AVi), containing a mitochondrion, endoplasmic reticulum membranes and ribosomes. Autophagic vacuoles (white arrowhead), mitochondria swelling and cristae vague (white arrows) as well as GO materials (*) were denoted; b F98 cells were treated with 60 µg/mL GO for 24 h. In addition, autophagy activator rapamycin (8 nM) was added for the same time as a positive control. The imagines of LC3 fluorescent labeling were captured under a fluorescence microscope; c–e the expression of P62 and LC3 II/I in F98 cells after treating with 40, 60 and 80 µg/mL GO for 24 h; f–i The expression of PI3K, Akt/p-Akt and mTOR/p-mTOR in F98 cells after exposing to 40, 60 and 80 µg/mL GO for 24 h. All datas expressed as mean ± SD in three independent experiment results. *p < 0.05, **p < 0.01 and ***p < 0.001 vs. control group

