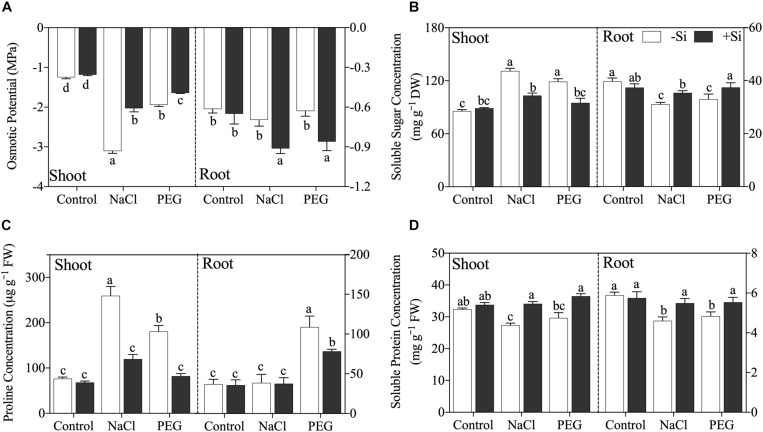
FIGURE 3.
(A) Tissue sap osmotical potential, (B) soluble sugar concentration, (C) proline concentration, and (D) soluble protein concentration in shoot and root. Rice were grown hydroponically with control, 100 mM NaCl (NaCl), and 18% (w/v) PEG-6000 (PEG) in the absence (−Si, white column) or presence (+ Si, black column) of 1.5 mM Si for 5 days. The data are the mean values ± SE of three independent biological replicates, and different letters show significant differences (P < 0.05).

