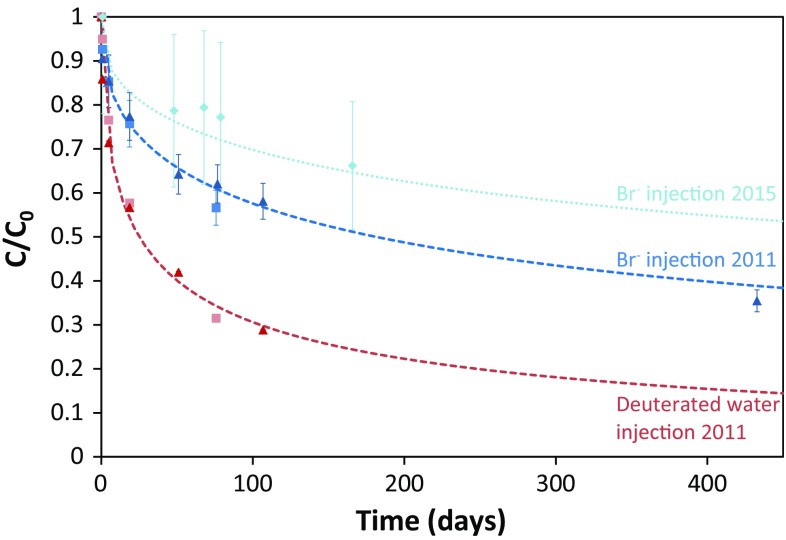
Fig. 4.
Evolution of the bromide (blue) and deuterated water (red) concentration (represented in relative concentrations or C/C0) measured in the water in Interval 1 (triangles) and 2 (rectangles) during the first tracer diffusion tests in 2011. For Interval 1 a second bromide test was performed in 2015 (light blue diamonds). The expanded error (95% confidence) on the relative concentrations of bromide and deuterated water is, respectively, 6–22% and 0.55%. The dashed lines indicate the modeled concentrations based on a pore diffusion coefficient of bromide (2 × 10⁻¹¹ m2 s−1) and of deuterium (1.2 × 10⁻¹⁰ m2 s−1), obtained based on the data from the first tracer diffusion tests in 2011. The dotted line indicates the modeled concentration for bromide based on the pore diffusion coefficient derived from the 2nd bromide diffusion test in 2015 (1 × 10⁻¹¹ m2 s−1)

