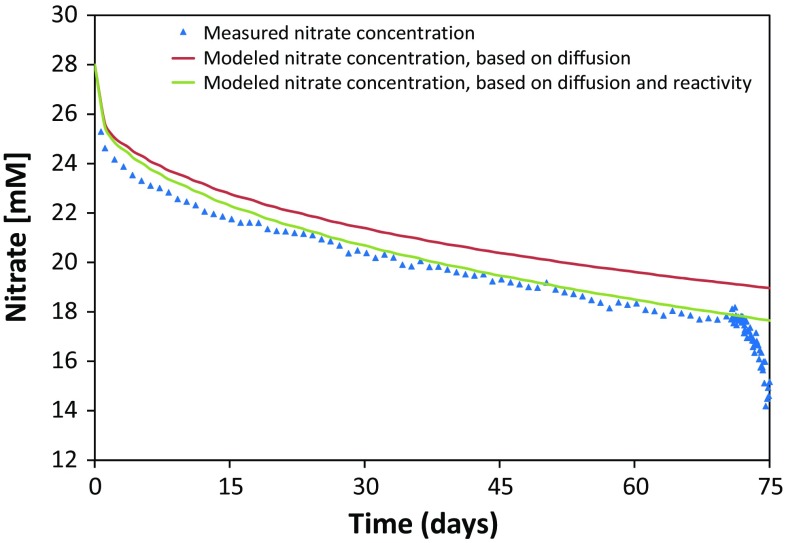
Fig. 6.
Comparison of measured (blue triangles) and modeled concentrations of nitrate after injection in Interval 2 during stage I. The modeled results were obtained using the pore diffusion coefficient of bromide (1.0 × 10⁻¹¹ m2 s−1), derived from the second bromide tracer diffusion test carried out in 2015. Either only diffusion (red) or a combination of diffusion and nitrate reactivity (green) were taken into account in the model to fit the measured data

