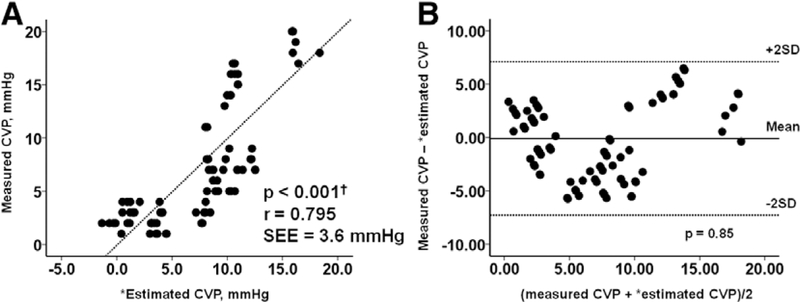
Figure 2.
The correlation between measured CVP and estimated CVP in the derivation cohort are shown in part A. The Bland-Altman plot for the comparison of measured CVP and estimated CVP in the derivation cohort is shown in part B. There is a moderate positive correlation (r = 0.795) and good agreement (mean difference −0.14 ± 1.77 mmHg) between the measured CVP and estimated CVP. ‘Estimated CVP = 47.90–0.086 ×(RA lead impedance) + 0.013 × (RV lead impedance)− 0.020 × (LV lead impedance). CVP, central venous pressure; LV, left ventricular; RA, right atrial; RV, right ventricular; SD, standard deviation; SEE, standard error of estimate.

