FIG 1.
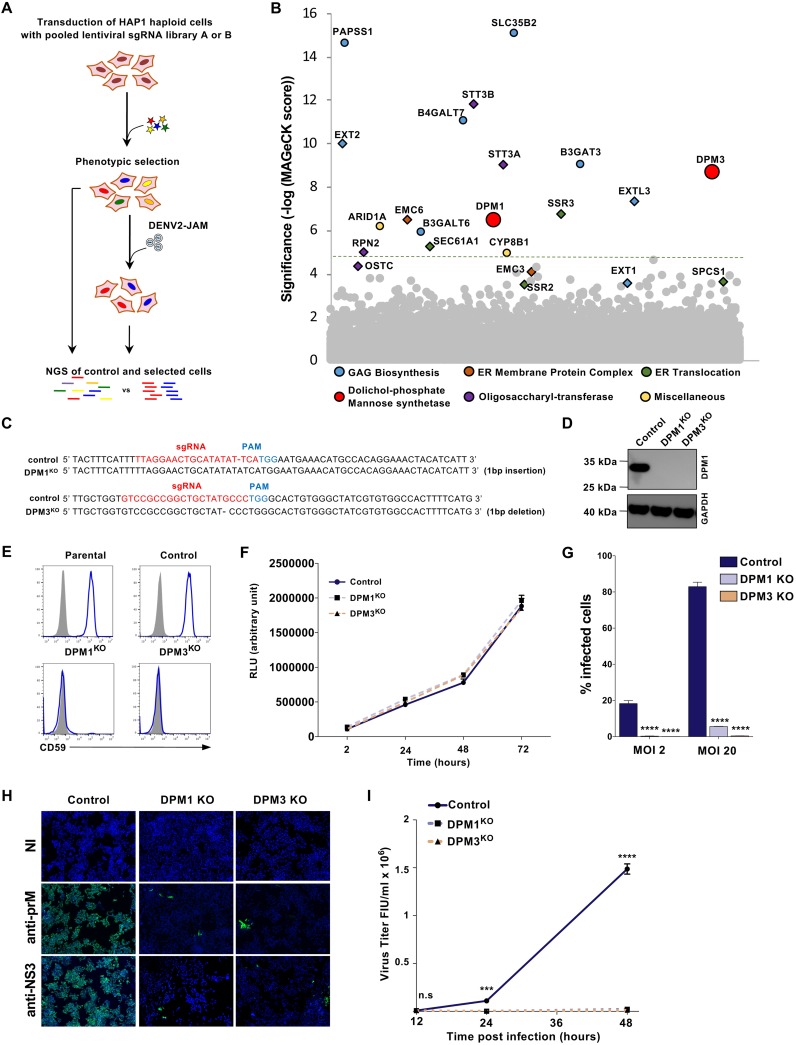
Haploid CRISPR-Cas9 screen identifies DPM1 and -3 as host factors for DENV infection. (A) Schematic representation of the CRISPR-Cas9 screen to identify host factors for DENV2 JAM in HAP1 cells. (B) Results of the DENV2 JAM screen analyzed by MAGeCK. Each circle represents individual gene. Genes of interest were colored according to their biological pathways. The y axis represents the significance of sgRNA enrichment of genes in the selected population compared to the unselected control population. The x axis represents a random distribution of the genes. (C) Sanger sequencing of DPM1 and DPM3 in control and DPM1 and DPM3 KO cells. PAM, protospacer adjacent motif. (D) Immunoblot of DPM1 in control, DPM1KO, and DPM3KO cells. (E) Cell surface CD59 staining on control and DPM1KO or DPM3KO HAP1 cells. (F) Control, DPM1KO, and DPM3KO HAP1 cells were plated and cell viability was assessed over a 72-h period using the CellTiter-Glo assay. (G and H) Control and DPM1 or -3 KO HAP1 cells were challenged with DENV2 JAM (MOIs of 2 and 20 in panel G and MOI of 5 in panel H). Levels of infection were quantified 48 hpi by flow cytometry using MAb 2H2 (G) or by immunofluorescence using MAb 2H2 or antibodies against NS3 (H). (I) Quantification of the viral particles released in the supernatant of inoculated HAP1 cells collected at 48 hpi. Virus titer was determined on Vero E6 cells by flow cytometry. FIU, flow cytometry infectious units. (C, D, E, F, and H) All data are representative of results from at least two independent experiments. (G and I) Data are means ± SD from three independent experiments performed in duplicate. Significance was calculated using a two-way ANOVA with Dunnett’s multiple-comparison test. n.s, nonsignificant. ***, P < 0.001; ****, P < 0.001.

