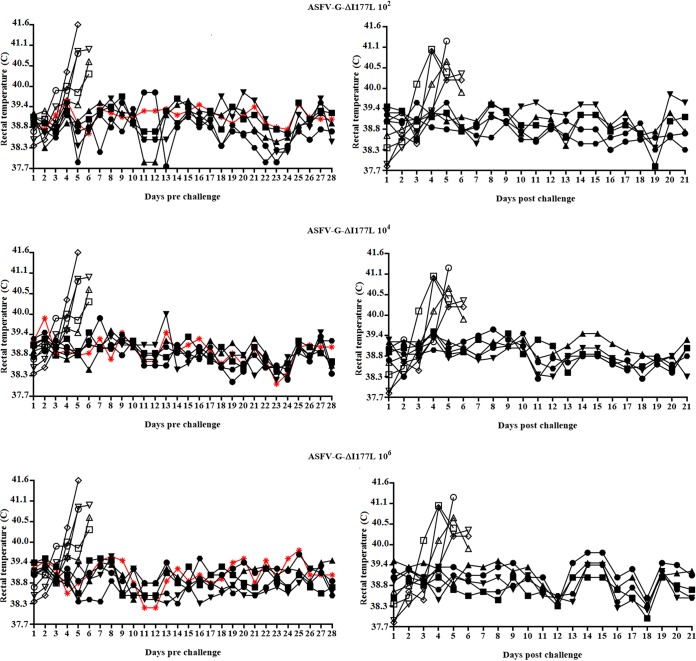
FIG 6.
Kinetics of body temperature values in pigs i.m. inoculated with either 102, 104, or 106 HAD50 (top of each panel) of ASFV-Georgia-ΔI177L (filled symbols), mock inoculated (sentinels, shown in red), or 102 HAD50 of ASFV-G (open symbols) (left) and after the challenge with 102 HAD50 of ASFV-G (right). Each curve represents an individual animal’s values in each group. Data from sentinel animals are depicted in red.

