FIG 8.
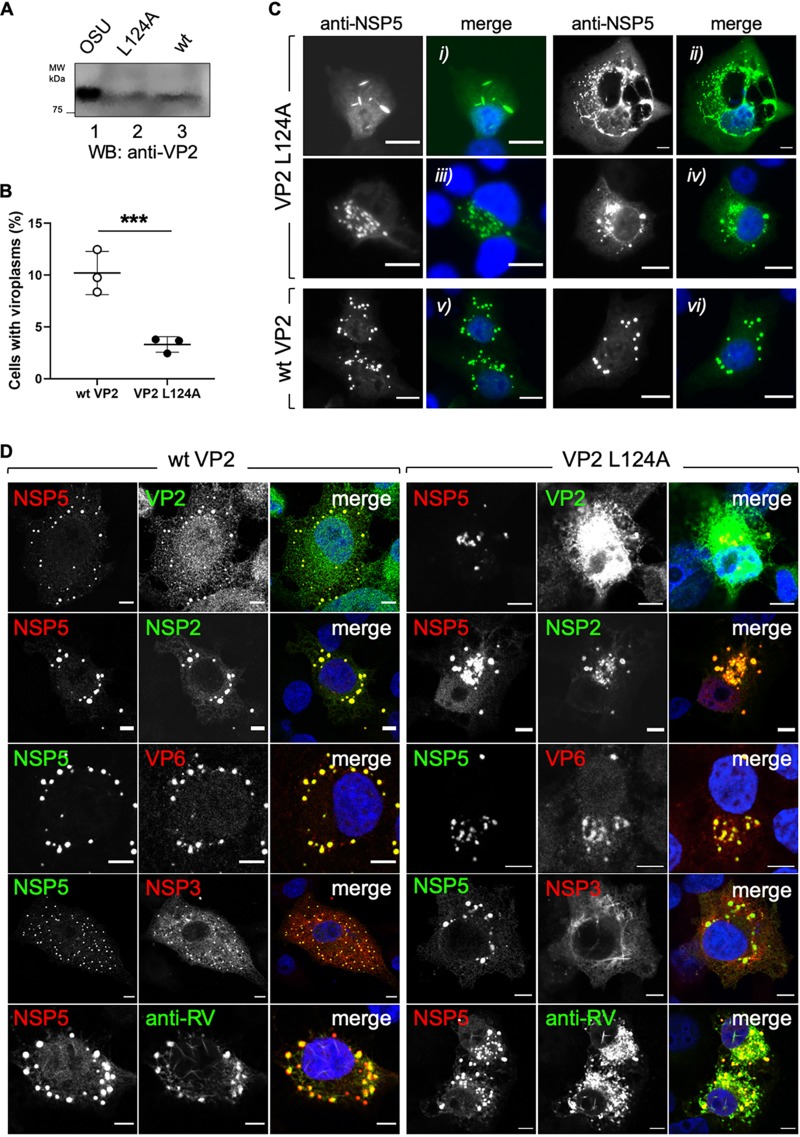
Viroplasms are damaged by VP2 L124A expression. (A) Immunoblotting of lysates from BSR-T7 cells expressing wt VP2 (lane 2) and VP2 L124A (lane 3) at 48 hpt. OSU virus particles were used as a positive control (lane 1). (B) Plot of the percentage of cells showing viroplasms when expressing either wt VP2 or VP2 L124A. A cell was considered viroplasm positive when anti-NSP5 cytosolic inclusions were detected. Data are represented as means ± SD from three independent experiments. ***, P < 0.001 by two-tailed unpaired Student's t test, n > 1,500 cells per experimental point. (C) Representative immunofluorescence images comparing viroplasm morphologies (5 hpi) (anti-NSP5, green) of cells expressing VP2 L124A (upper, frames i, ii, iii, and iv) or wt VP2 (lower, frames v and vi). Nuclei were stained with DAPI (blue). Scale bar is 10 μm. (D) Confocal immunofluorescence of RV proteins of cells expressing wt VP2 (left) or VP2 L124A (right). At 24 hpt, BSR-T7 cells were RV infected (MOI, 75 VFU/cell). At 5 hpi, cells were fixed and immunostained for the detection of NSP5 (anti-NSP5, green or red), VP2 (anti-VP2, green), NSP2 (anti-NSP2, green), VP6 (anti-VP6, red), NSP3 (anti-NSP3, red), and VP6, VP7, and VP4 (anti-RV, green). Nuclei were stained with DAPI (blue). Scale bar is 5 μm.

