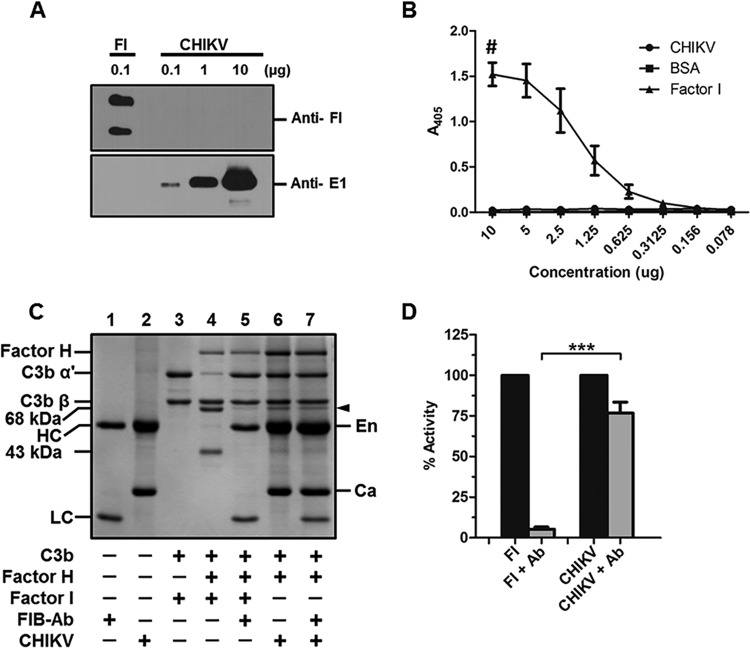
FIG 7.
The factor I-like activity associated with CHIKV is not due to human factor I. (A) Western blotting to check if host factor I is bound to CHIKV. No reactivity to anti-human factor I antibody was observed in the lanes containing 0.1, 1, or 10 μg of CHIKV, while robust signal was seen in the factor I (FI) control lane (top panel). A positive reactivity to anti-E1 antibody correlating to the levels of CHIKV is evident from the bottom panel. The image is a representation of three independent experiments. (B) ELISA to detect bound host factor I. Various concentrations of gradient-purified CHIKV, factor I, or BSA as indicated in the x axis of the graph were coated and probed with anti-human factor I to detect bound factor I if any. The dose-dependent response can be seen in the case of the positive control factor I with background levels of binding in the case of CHIKV-and BSA-immobilized wells. The data are the mean ± SEM of 3 independent experiments. The # symbol indicates that the initial concentration of human factor I begins with 1 μg. (C) Factor I inhibition assay. C3b cofactor activity was reconstituted with purified CHIKV, C3b, factor H, or factor I in either the presence or absence of a human factor I function-blocking antibody. The effects were assessed using SDS-PAGE followed by GelCode blue staining. The function-blocking antibody was found to completely inhibit the C3b-α′ cleavage by factor I (lane 5) compared to the no-antibody control (lane 4). The antibody did not have any effect on the factor I-like activity associated with CHIKV (lane 7). The labels En and Ca indicate the position of the envelope and nucleocapsid protein, respectively, while HC and LC indicate the heavy and the light chain of the blocking antibody, respectively. (D) The experiments were carried out in triplicate, and the percent reduction in the proteolytic activity of factor I or CHIKV in the presence or absence of factor I functional blocking antibody was assessed by performing a densitometry analysis of the 68-kDa fragment generated using Image Lab software. The data are the mean ± SEM with. ***, P ≤ 0.01.

