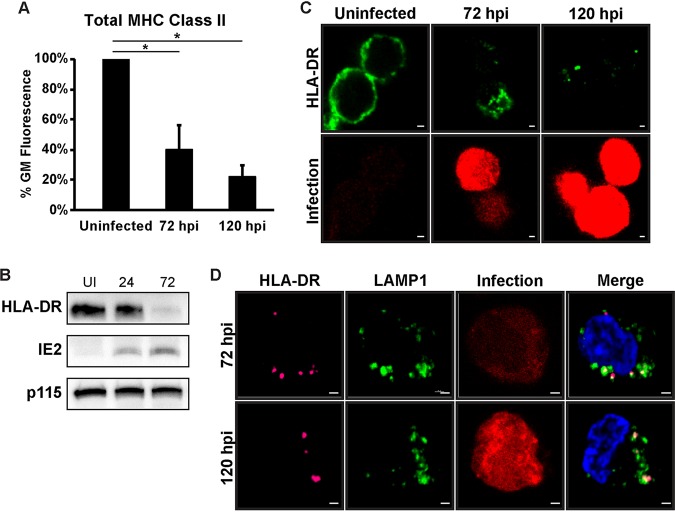
FIG 2.
Total MHC class II is reduced during HCMV infection. (A) Bar graph of the geometric mean fluorescence values of total HLA-DR protein in uninfected and infected samples (72 and 120 hpi). Values are a percentage of the value for the uninfected sample and are averages from at least three independent experiments. *, P < 0.05. (B) Western blot analysis of uninfected and HCMV-infected Kasumi-3 cells at 24 and 72 hpi to detect HLA-DR, IE2, and p115 (loading control) protein levels. (C) Immunofluorescence of total HLA-DR protein (green) in uninfected and HCMV-infected Kasumi-3 cells at 72 and 120 hpi. Infected cells expressed mCherry (red) from the genome as marker for infection. (D) Immunofluorescence of total HLA-DR (pink) and LAMP1 (green) in HCMV-infected (red) Kasumi-3 cells at 72 and 120 hpi. Nuclei stained with DAPI. Bars (C and D), 1 μm.

