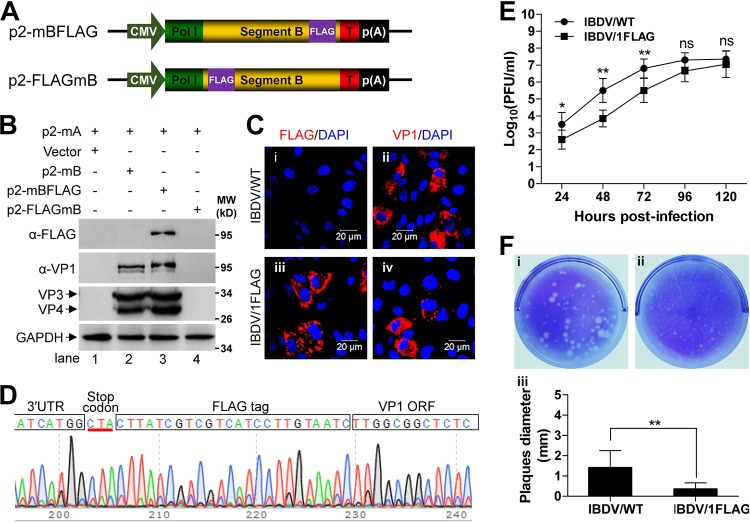
FIG 3.
Generation of recombinant IBDV expressing VP1-FLAG. (A) Schematic representation of the plasmids of p2-mBFLAG and p2-FLAGmB. CMV and Pol I stands for cytomegalovirus immediate early promoter and human Pol I promoter, respectively. T represents mouse Pol I terminator and p(A) stands for polyadenylation signal. (B) The supernatant of the 293T cells (6-well format) which were cotransfected with the indicated plasmids (2 μg of each plasmid in each group) for 72 h was passaged 3 times in DF-1 cells. Finally, the DF-1 whole-cell lysate was analyzed by Western blot using the antibodies against FLAG, VP1, and VP3, and GAPDH was probed as a loading control. (C) After implantation of DF-1 cells on the coverslip in 6-well plate, cells were infected (MOI, 1) with IBDV/WT or IBDV/1FLAG for 12 h, and then fixed and immunostained with the antibodies against VP1 (left column) or FLAG (right column), followed by the staining with Alexa Fluor-568-labeled secondary antibody. Nucleus was stained with DAPI. Scale bars = 20 μm. (D) After passage of IBDV/1FLAG in DF-1 cells for 30 times, the full length of viral segment B was amplified by RT-PCR and further used for Sanger sequencing. The chromatogram was screenshot to show the existence of FLAG tag sequence (full box) between VP1 ORF and 3′ untranslated region (UTR) (opened boxes), and the stop codon was underlined in red. (E) Monolayer of DF-1 cells (triplicates in 6-well plate) were infected with IBDV/WT or IBDV/1FLAG at an MOI of 0.1; the virus titers in the supernatant were determined by plaque assay at the indicated times. Data were presented as mean ± SD. ns, not significant; *, P < 0.05; **, P < 0.01. (F) The representative plaques formed by IBDV/WT (i) or IBDV/1FLAG (ii) in the monolayer of DF-1 cells (6-well format) were stained with 1% crystal violet at 96 h postinfection, and the histogram (iii) was plotted based on the diameter of 30 arbitrary plaques formed by IBDV/WT or IBDV/1FLAG. Data were presented as mean ± SD. **, P < 0.01.

