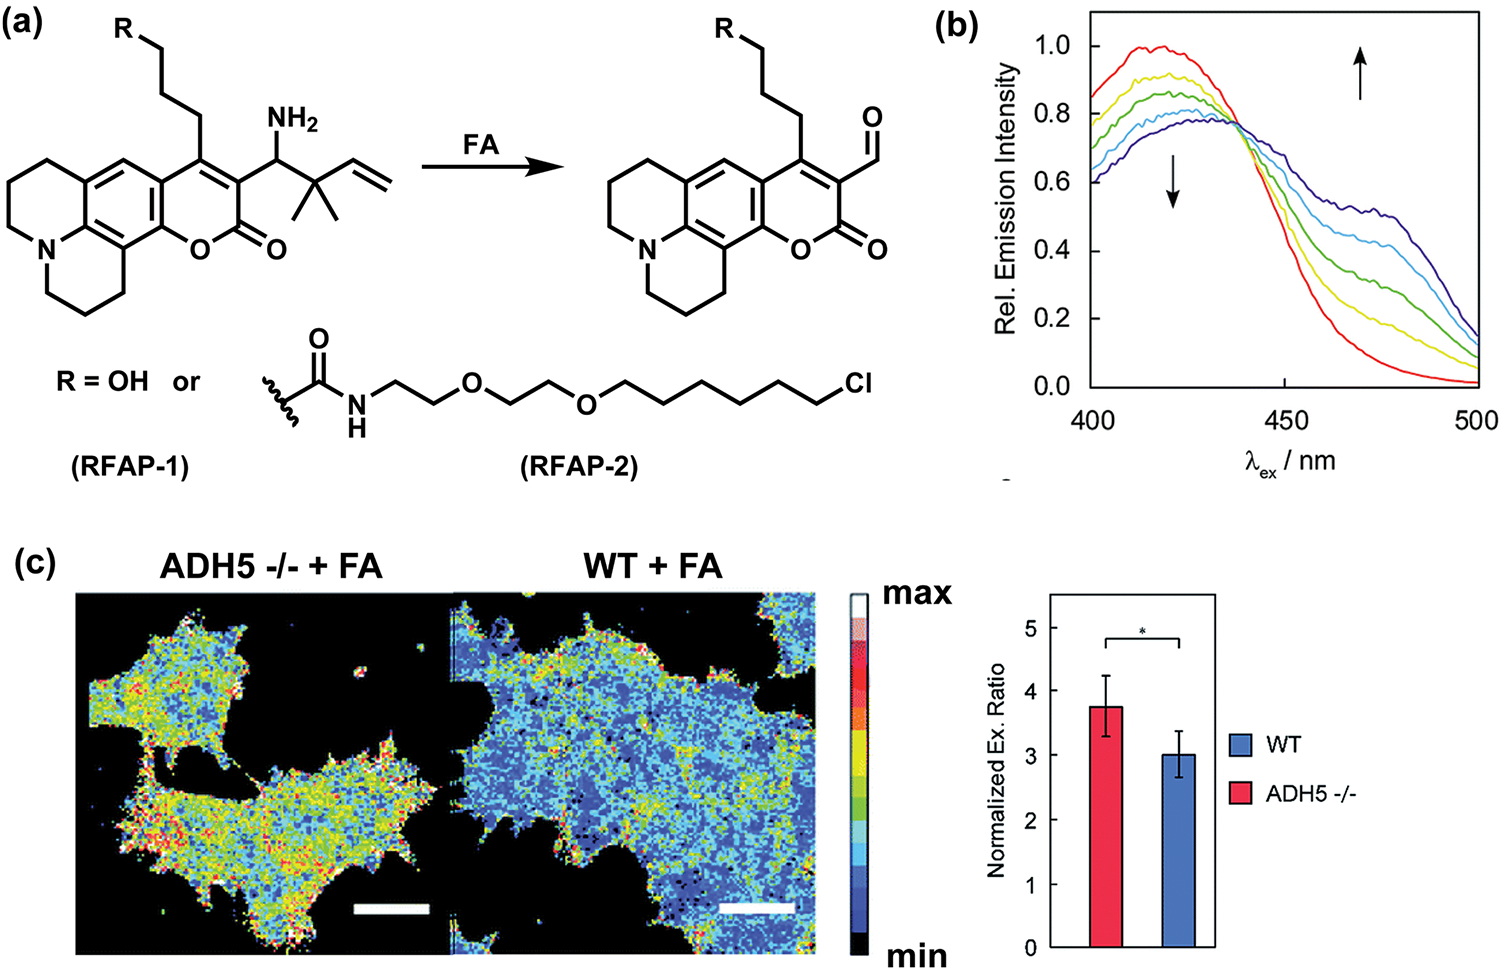
Figure 6.

Ratiometric ABS probes for FA. (a) Reaction scheme for FA detection by ratiometric probes RFAP-1 and RFAP-2. (b) Excitation spectra for 10 μM RFAP-2 responding to 100 μM FA at 0, 30, 60, 90, and 120 min (red, yellow, green, blue, and purple curves, respectively). (c) Confocal microscopy images of near-haploid (HAP-1) cells stained with 0.5 μM RFAP-2 for 60 min. WT, wild type; ADH5 −/−, alcohol dehydrogenase 5 knockout cells. Bar graphs present normalized excitation ratios (mean ± SEM, n = 5; *, P < 0.05). Adapted from ref 49. Published by The Royal Society of Chemistry.
