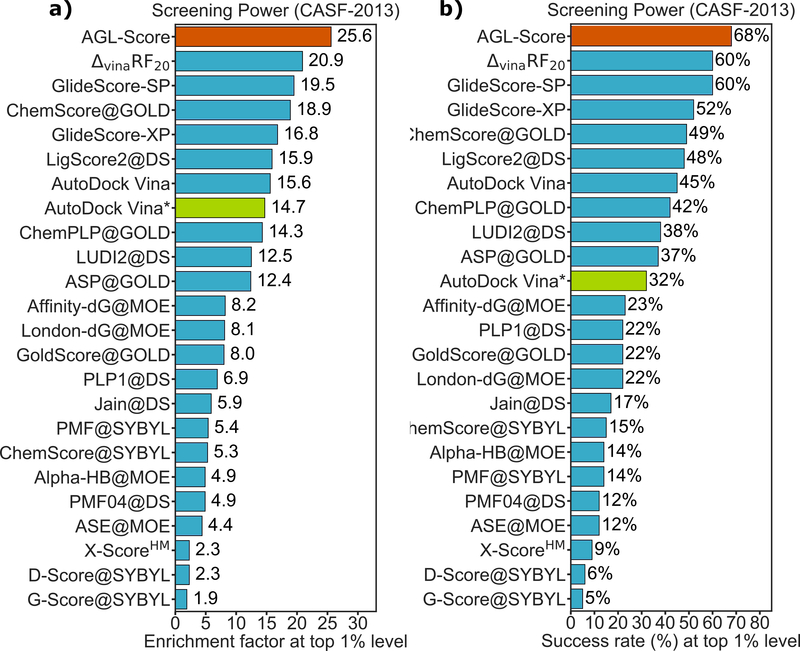
Figure 13:
The performances of various scoring functions on the screening power for CASF-2013 benchmark based on a) enrichment factor and b) success rate at the top 1% level. The orange bar indicates our graph-based models66. The green bar represents the results of Autodock Vina carried out in our lab. The teal bars express the performances of other models Refs.150,163.

