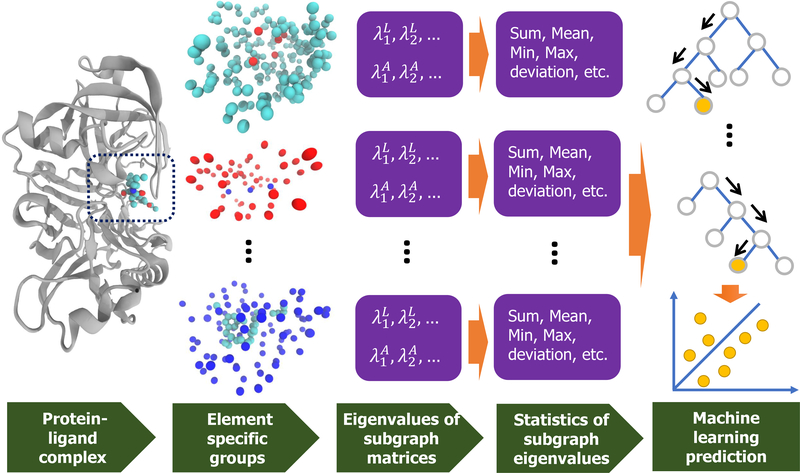
Figure 9:
A paradigm of the graph-based approach. The first column is the complex input with PDBID 5QCT. The second column illustrates the element-specific groups in the binding site. The third column presents the eigenvalues of the corresponding weighted colored graph Laplacian and adjacency matrices in the second column. The statistics of these eigenvalues are calculated in the fourth column. The final column forms a gradient boosting trees model using these eigenvalues.

