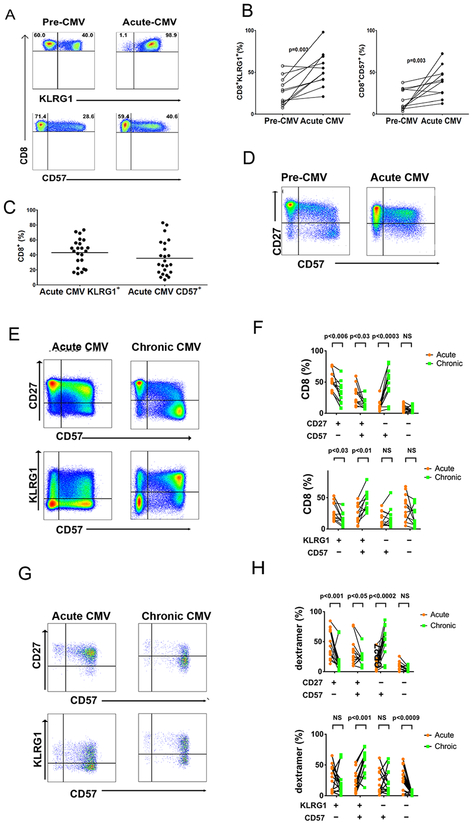
Figure 1. Rapid Induction of KLRG1+ and CD57+ surface expression in CMV specific CD8 TAEFF during acute primary CMV infection evolve into TEM during chronic infection.
(A) Representative flow cytometric plots show the expression of KLRG1+ (upper panel) and CD57+ (lower panel) in total CD8+ T cells from D+R-patient during Pre-CMV and Acute CMV infection. Total CD8+ T cells were gated on live CD3+ T cells after excluding CD14+, CD16+, and CD19+ cells. (B) Cumulative data showing distributions of total KLRG1+CD8+ (left graph) and CD57+CD8+ (right graph) T cells from patients during Pre-CMV and Acute CMV infection (n=8). Statistical analysis was performed using Wilcoxon matched pair signed rank test. Also Mann-Whitney U test was performed with a two-sided and p value of less than 0.05 considered statistically significant. (C) Cumulative data shows distributions of total CD3+CD8+ T cells KLRG1+ and CD57+ for (n=23) patients during Acute CMV) infection. (D) Representative flow cytometric plots show expression of CD57+ and CD27+ on CD8+ T cells during Pre-CMV (left plot) and Acute CMV (right plot). (E) Representative flow cytometric plots showing co-expression of CD57+ and CD27+ (upper panels) or KLRG1+ and CD57+ (lower panels) on the gated population of total CD3+CD8+ T cells ex vivo from D+R-patient during Acute CMV (left plots) and Chronic CMV (right plots) infection. (F) Cumulative data graph showing frequency of total CD8+ T cells expressing phenotypic markers as labeled. PBMCs from acute CMV (orange circles) and chronic CMV (green squares) (n=14 dextramer responses) D+R-patients were stained ex vivo and analyzed by flow cytometry. (G) Representative plots show CD57+ and KLRG1+ expression on MHC class I dextramer cells and co-expression of CD57+, and CD27+ or KLRG1+ on the gated population dextramer+ cells CD3+CD8+ T cells. (H) Cumulative data graph shows proportions of total CD8+ T cells proportions of MHC class I dextramer + cells from acute CMV (n=14 dextramer responses) (orange circles) and chronic CMV (n=14 dextramer responses) (green squares) infection, expressing distinct phenotypic markers are shown.

