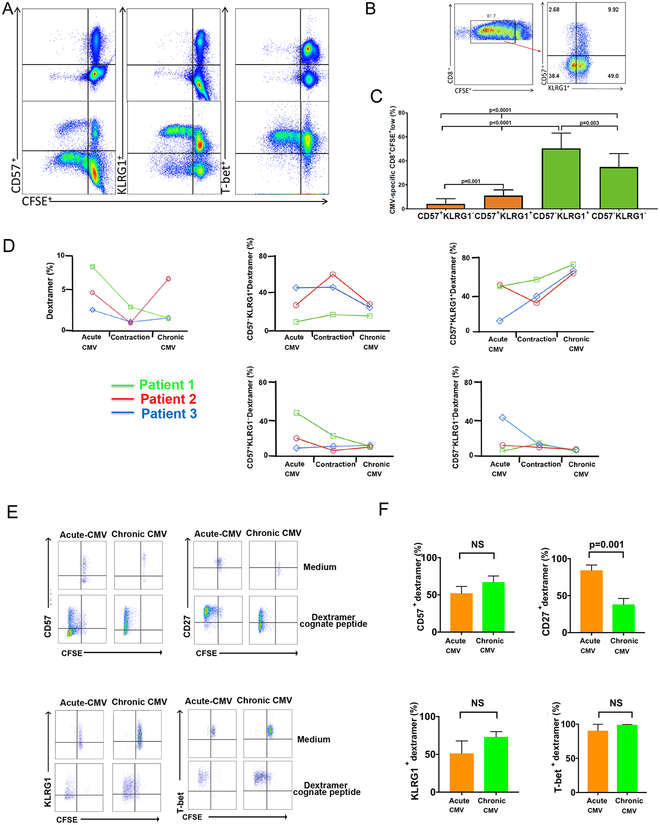
Figure 2. Phenotype and proliferation of CD57+ and/or KLRG1+ CMV-specific CD8+ T cells from primary into chronic CMV infection.
(A) Representative flow cytometry plots from the Acute CMV showing phenotype and CMV pp65-specific proliferation in response to pp65 pooled peptides (lower panels) or medium alone (negative control) (upper panels), KLRG1+ (middle panels) and T-bet+ (right panels). (B) Representative flow plot from (A) showing KLRG1+/− and CD57+/− phenotypes in CD8+CFSElo subset (right panel). (C) Cumulative data showing CMV pp65-specific proliferation at 6 days for CD8+ T cells with respect to CD57+ (orange bars), CD57− (green bars) of CFSElo events (n=7). Bars represent median values of CFSElo events for CD57+KLRG1−, CD57+KLRG1+, CD57−KLRG1+ and CD57−KLRG1− respectively. Statistical analysis performed using Mann-Whitney U test with a two-sided and p value of less than 0.05 considered statistically significant. (D) Graphs showing frequencies of CMV-dextramer CD8+ T cells, and KLRG1+/− CD57+/− subsets in three patients during Acute-CMV, Contraction phase, and Chronic CMV infection. Samples for the contraction phase were obtained 1–2 months following clearance of acute viremia and Chronic CMV at least a year post-Acute CMV. (E) Representative flow cytometry plots of CMV dextramer proliferation in response to cognate peptide re-stimulation or medium measured at 6 days using CFSE dilution. Shown are responses during Acute-CMV and Chronic CMV and phenotypic markers CD57+ (upper left), CD27+ (upper right), KLRG1+ (lower left) and T-bet+ (lower right) plots. (F) Cumulative data from (E) showing respective phenotypes of CFSElo events in dextramer+ cells. during Acute-CMV (orange bars) and Chronic CMV (green bars). Bars represent median values of CFSElo frequencies. Statistical analysis performed using Mann-Whitney U test with a two-sided and p value of less than 0.05 considered statistically significant. NS=non-significant.

