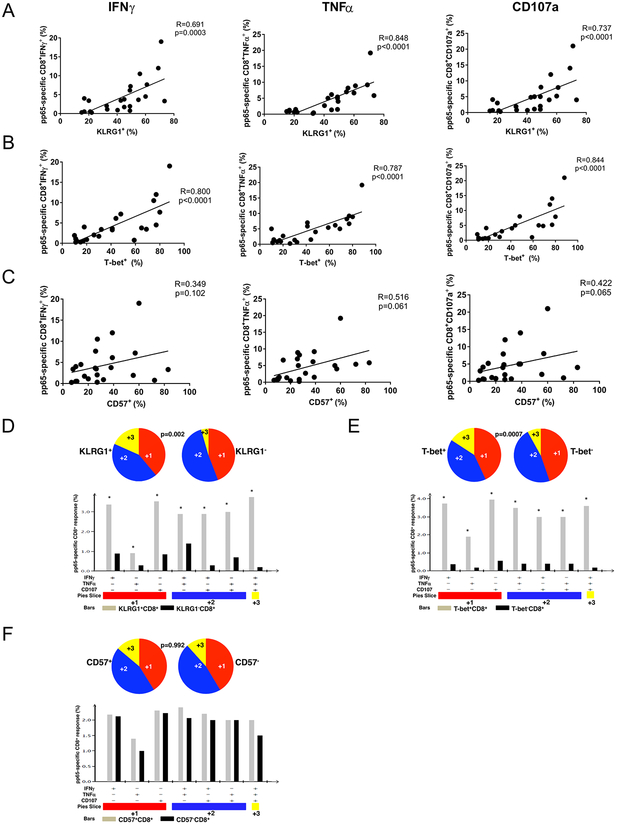
Figure 3. CMV pp65-specific CD8+ effector responses reciprocally correlate with T-bet and KLRG1 expression but not with CD57 and CD8+KLRG1+ effectors have higher quantity and quality of multifunction during acute primary CMV infection similar to CD8+T-bet+ effectors.
(A) Cumulative correlation data (n=23) by scatter plot analysis of KLRG1+, T-bet+ (B) and CD57+ (C), frequencies and CMV-specific pp65 frequencies for CD8+IFNγ+ (left panels), tumor necrosis factor (TNFα) CD8+TNFα (middle panels) and CD8+CD107a+ (right panels) during acute CMV infection from the LTR cohort. Correlation coefficient (R) and p values were calculated using Spearman rank correlation test. (D) Individual pie charts of PBMC reflecting CD8+KLRG1+ (left pie) and CD8+KLRG1− (right pie) of T cell effector multifunction (E) CD8+T-bet+ (left pie) and CD8+T-bet− (right pie) of CMV pp65–specific T cell effector multifunction and (F) CD8+CD57+ (left pie) and CD8+CD57− (right pie) of CMV pp65–specific T cell during acute primary CMV infection responses (IFN-γ, TNF-α, CD107a) from the LTR cohort effector multifunction. Using Boolean analysis, the percentage of total and individual effector multifunctional subset responses for CD8+ T cells from KLRG1+ (gray bars) and KLRG1− (black bars) or T-bet+ (gray bars) and T-bet− (black bars) or CD57+ (gray bars) and CD57− (black bars) are shown in the bar graph for each of the multifunctional subsets. * p<0.05. *Significant differences when comparing mean frequencies of single and multifunctional responses, p less than or equal to 0.05. All pvalues were determined by the Kruskal-Wallis one-way ANOVA or Wilcoxon signed rank test. Data analyzed using the program SPICE.

