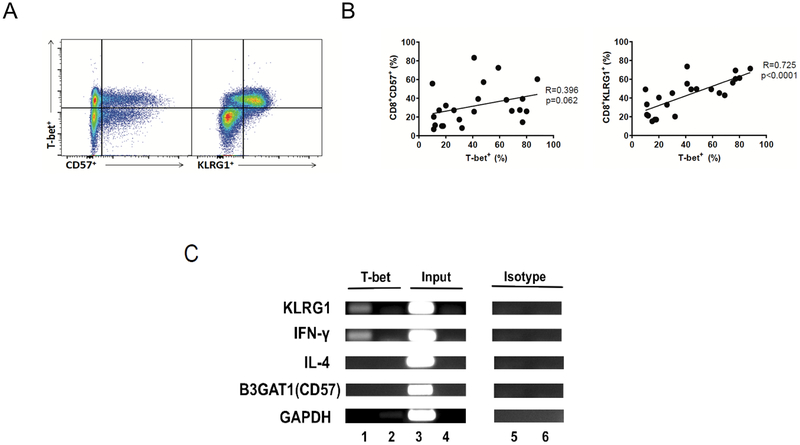
Figure 4. T-bet expression significantly correlates with KLRG1 in CD8+ T cells during primary CMV infection and T-bet interacts with the KLRG1 promoter in human T cells.
(A) Representative flow cytometric plots showing co-expression of T-bet+ and KLRG1+ or CD57+ gated on live CD3+CD8+ T cells. This is a representative of n=23 individuals. (B) Cumulative correlation data (n=23) by scatter plot analysis of T-bet+ and CD8+CD57+ (left panel), and CD8+KLRG1+ (right panel), frequencies during acute CMV infection from the LTR cohort. A black line indicates the regression line as well as R and p value that were generated using the Spearman’s Rank Correlation test. (C) Agarose gel images showing bands of semi-quantitative PCR amplicons that reside in the promoter sequence of T-bet targets, KLRG1, CD57 (B3GAT1) and IFN-γ (positive control) as performed by ChIP assay. Also shown are non T-bet targets, IL-4 (negative control), and GAPDH (negative control) genes. ChIP assay was performed using human Jurkat T cell line using mouse anti-human TBX21 antibody (clone 39D; IgG1). Immnunoprecipitated DNA was subject to PCR amplification using primer sets for KLRG1, CD57(B3GAT1), IFN-γ, IL-4, and GAPDH targets (lane 1) for each corresponding region of promoter sequences in proximity to the T-bet binding site for each gene. Results of PCR amplifications of input DNA (lane 3) or mouse IgG1 isotype control antibody (lane 5) are also shown. Lanes 2, 4, and 6 show non-template PCR negative controls.

