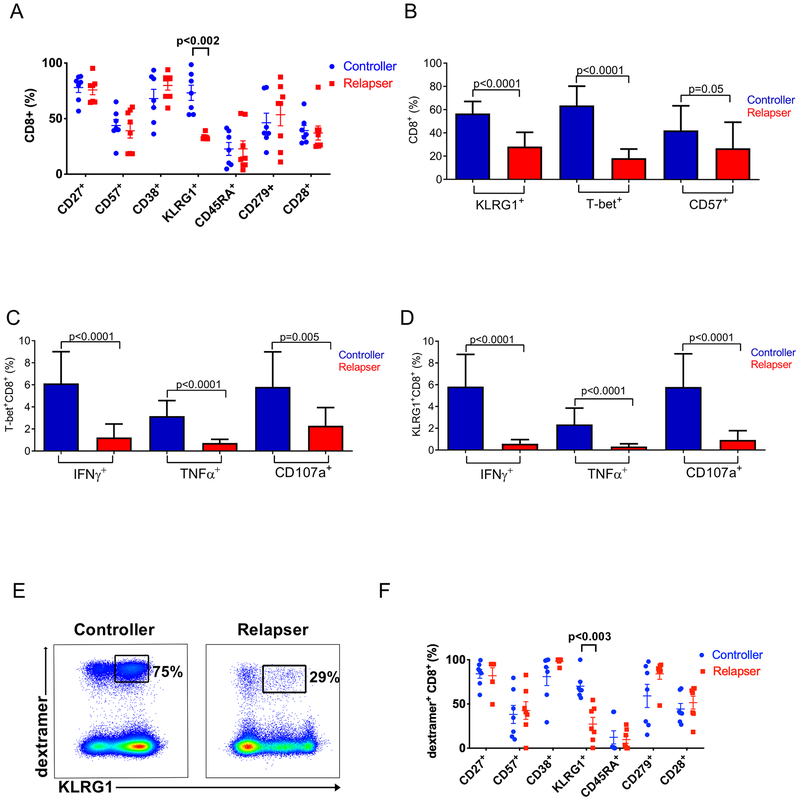
Figure 5. Significantly higher frequencies of KLRG1+ total CD8+ and CMV-specific CD8+ T cells are found in viremic controllers compared to relapsers.
(A) Cumulative distributions of KLRG1 frequency and additional six phenotypic markers expressed on the total CD8+ T cell among controllers (blue circles) (n=7) and the relapsers (red squares) (n=8) are shown (mean ± SEM). Only the KLRG1 expression exhibits the significant difference (p<0.002) between controllers and relapser as indicated. (B) Cumulative data shows frequency of KLRG1+, T-bet+, or CD57+ total CD8+ T cells among controllers (blue columns) (n=13) and relapsers (red columns) (n=10). (C) Cumulative data shows Tbet+CD8+ frequencies and (D) KLRG1+CD8+effector functions (IFN-γ+, TNF-α+, CD107a+) in controllers (blue columns) and relapsers (red columns). (E) Representative flow cytometric plot shows KLRG1+ expression on CMV-specific dextramer+CD8+ T cells. Numbers show proportion of KLRG1+ subset within the gated dextramer+CD8+ T cell in a controller (left panel) versus a relapser (right panel). (F) Cumulative distributions of KLRG1+ frequency and additional six phenotypic markers expressed on the Dextramer+CD8+ T cell among controllers (blue circles) (n=8 dextramer responses assed) and the relapsers (red squares) (n=7 dextramer responses assed) are shown (mean ± SEM). Statistical analysis performed using Mann-Whitney U test with a two-sided and p value of less than 0.05 considered statistically significant between the controller and the relapser throughout the course of statistical analyses. NS=non-significant.

