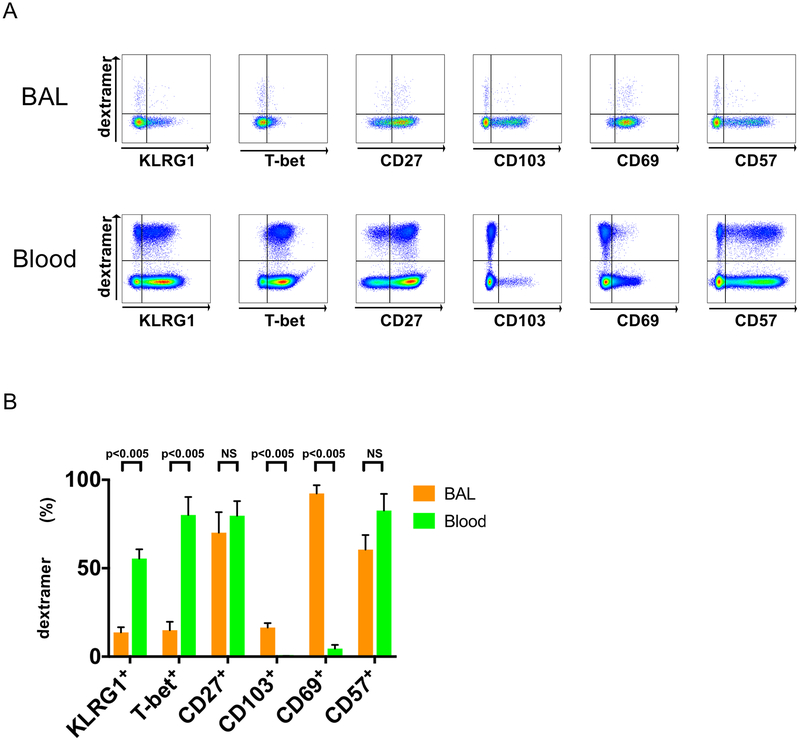
Figure 6. CMV-specific Dextramer+CD8+ T cells in BAL express lower levels of KLRG1 and T-bet transcription factor than PBMC.
(A) Representative flow cytometry plots of CMV dextramer+CD8+ Tcells BAL cells (upper panels) and Blood (lower panels) during acute/primary CMV infection (n=6) for a panel of six markers: KLRG1+, T-bet+, CD27+, CD103+, CD69+ and CD57+ plots. (B) A cumulative data of summary of phenotypic frequency analysis of (A) showing BAL cells (orange bars) and PBMC (green bars). Statistical analysis performed using Mann-Whitney U test with a two-sided and p value of less than 0.05 considered statistically significant between the BAL and Blood compartments. NS=non-significant.

