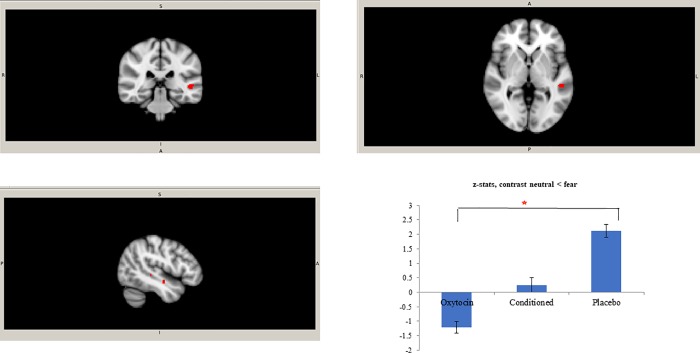
Fig 3. Clusters in left superior temporal gyrus, contrast neutral < fearful.
Clusters in the left superior temporal gyrus (cluster 1: -50, -32, 0; t max = 4.23, cluster size = 41; cluster 2: -46, -10, -12; t max = 4.84; cluster size = 14) with the significantly lower activation in the oxytocin group in comparison to the placebo group on the contrast neutral < fearful and mean Z statistics with standard deviations from these clusters.

