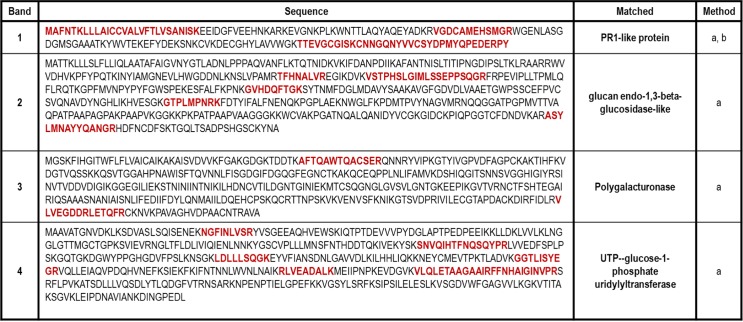
Fig 2. Identification of IgE binding bands.
IgE binding bands present in PT extract were identified by peptide mass fingerprint (method a) and MS/MS analysis (method b). Fragment matched by MS analysis are shown in red. The identification was carried out in the proteomics service of Complutense University of Madrid. (https://www.ucm.es/gyp/proteomica).

