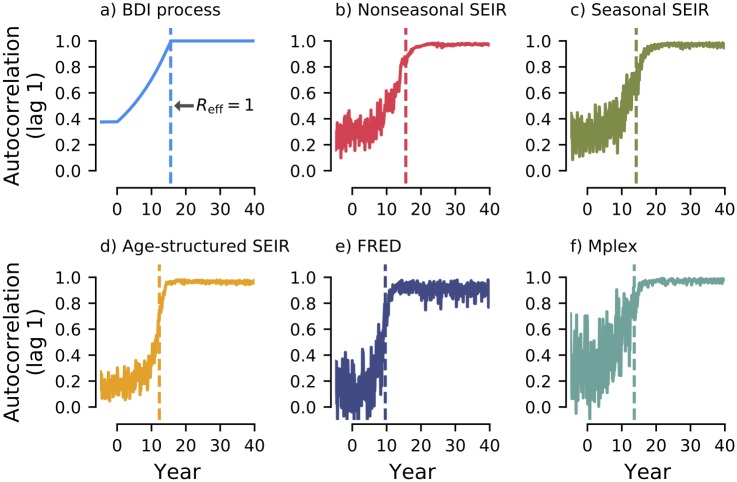
Fig 5. The autocorrelation at lag one month through time.
a) Theoretical benchmark using the BDI process, given by Eq 11. b-f) Estimates for the autocorrelation calculated for each month from the ensemble of realisations. MAP estimates of the time of emergence, , are indicated by dashed vertical lines. For all models, the autocorrelation increases as the time of emergence is approached, indicative of CSD.

