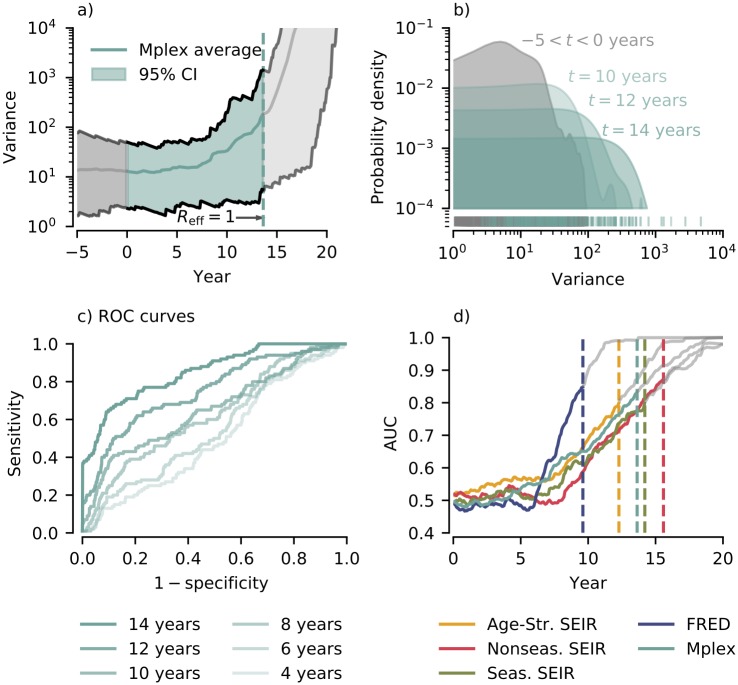
Fig 6. Performance of the variance at detecting emergence.
a) Variance for the Mplex model calculated using an exponentially weighted moving window with a half life of 3 years. Mean and 95% credible interval calculated using 100 realizations. b) Test (green) and null (grey) probability densities for the variance. Probability densities found using kernel density estimation (see Methods). Null probability density calculated using all data points in the interval −5 < t < 0 years. Test probability densities shown for t = 10, 12, 14 years. c) ROC curves for the variance for the Mplex model shown for 2 year intervals. d) Area Under the ROC Curve (AUC) through time for the variance for each model. Vertical lines indicate the time of emergence.

