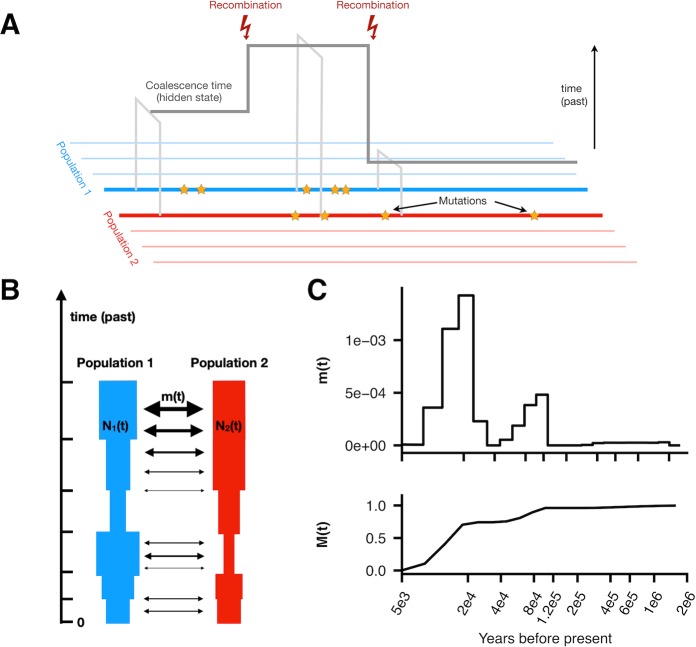
Fig 1. Schematic of MSMC2 and MSMC-IM.
(A) MSMC2 analyses patterns of mutations between pairs of haplotypes to estimate local coalescence times along the genome. (B) MSMC-IM fits an isolation-migration model to the pairwise coalescence rate estimates, with time-dependent population sizes and migration rate. (C) As a result, we obtain the migration rate over time, m(t), and the cumulative migration probability, M(t), which denotes the probability for lineages to have merged by the time t and which we use to estimate fractions of ancestry contributed by lineages diverged deeper than time t.

