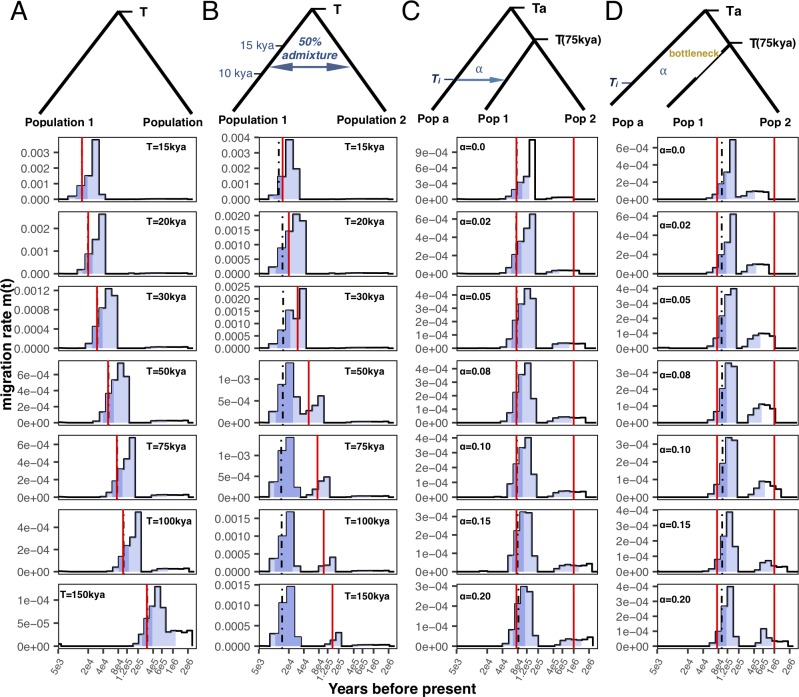
Fig 2. Simulation results.
(A) Clean-split scenario: Two populations with constant size 20,000 each diverged at split time T in the past, varying from 15kya to 150kya. (B) Split-with-migration scenario. Similar to A), with T varying between 15-150kya, and a post-split time period of symmetric migration (amounting to a total migration rate of 0.5 in both directions) between 10 and 15kya. (C) Split-with-archaic-admixture scenario: Similar to A), with T = 75kya, and population 1 receiving an admixture pulse at 30kya from an unsampled population that separates from the ancestral population at 1 million years ago. The admixture rate varies from 0% to 20%. (D) Split-with-archaic-admixture&bottleneck scenario: Similar to C), but with an added population bottleneck with factor 30 in population 1 between 40-60kya. Solid red lines indicate split times in all panels. In all plots, the blue light blue shading indicates the interval between 1–99% of the cumulative migration probability, the dark blue shading from 25–75%, and the black dashed vertical line indicates the median.

