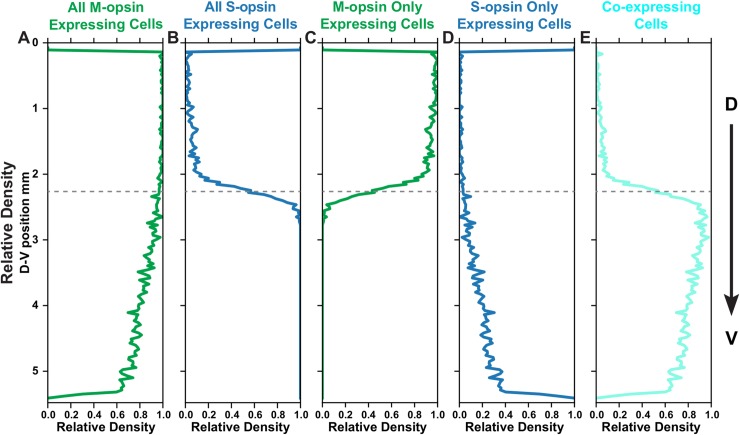
Fig 3. Spatial distribution of M- and S-opsins in cone cells.
Relative density of a cone population summed horizontally across the image and displayed in the dorsal to ventral position. Dotted line represents midpoint of transition zone. (A) All M-opsin expressing cells. (B) All S-opsin expressing cells. (C) M-opsin only expressing cells. (D) S-opsin only expressing cells. (E) Co-expressing cells.

