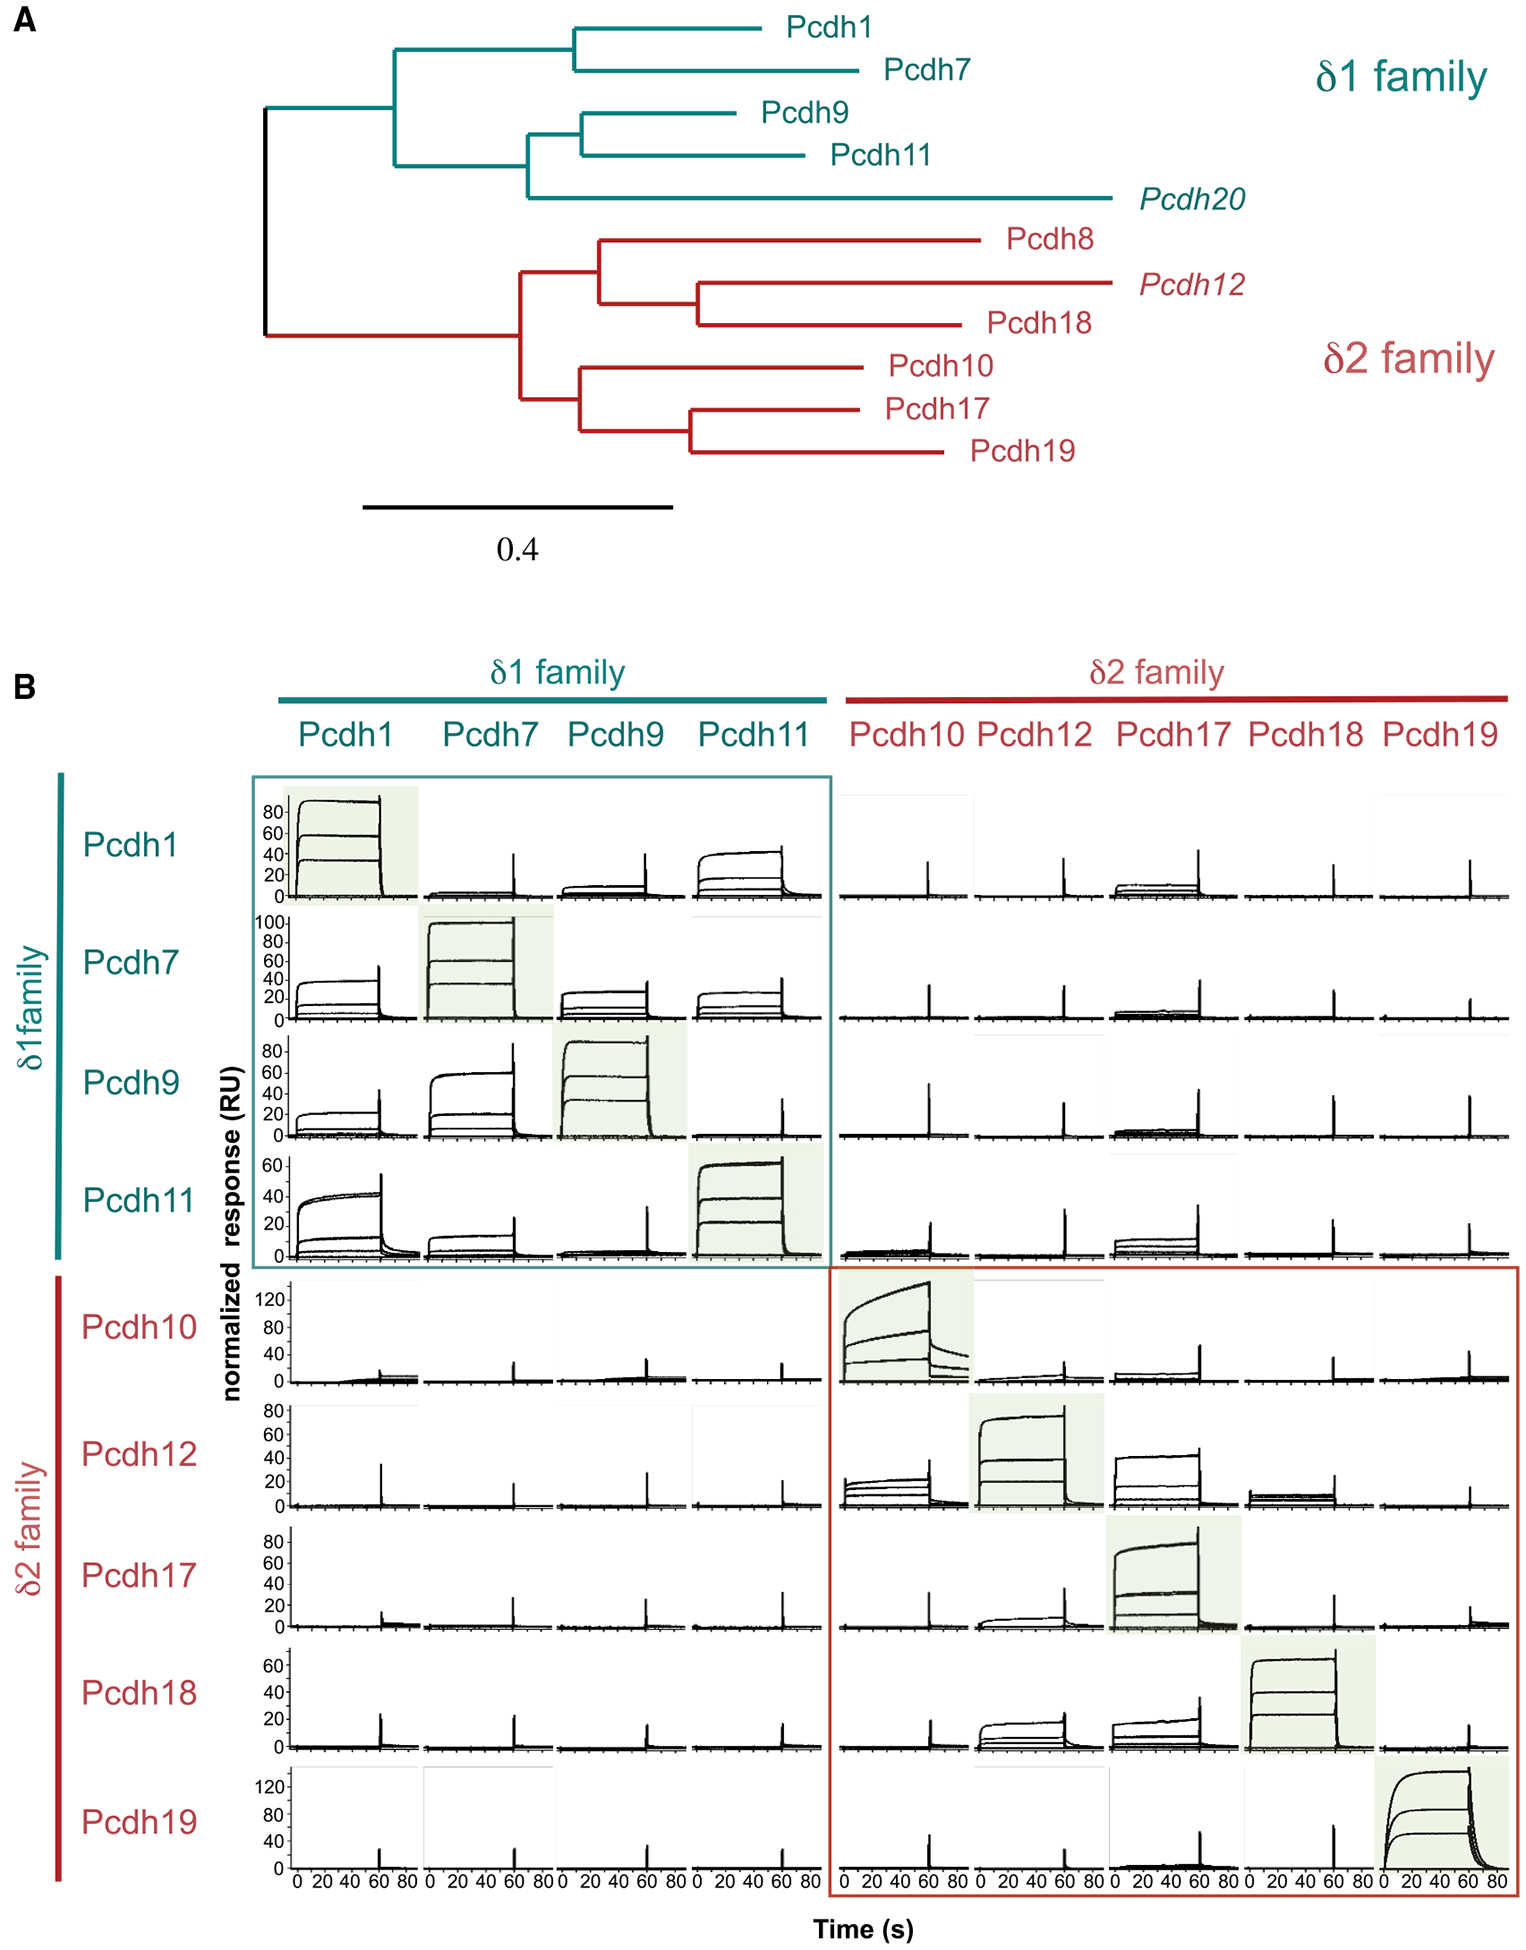
Figure 1. SPR Analysis of trans Binding Interactions in the δ-protocadherin Family.

(A) Phylogenetic tree of human δ-protocadherins from aligned full-length amino acid sequences. Atypical members italicized. Scale indicates protein distance.
(B) SPR binding profiles of δ-protocadherin analytes (columns) over surfaces coated with the same set of proteins (rows).
Analyte concentrations of 27, 9, and 3 μM are plotted on each panel. Responses are normalized for molecular weight and scaled for each surface, permitting comparison across rows only. Homophilic combinations are highlighted in green; heterophilic interactions within δ1- and δ2-subfamilies are boxed in teal and red. See Figure S1.
