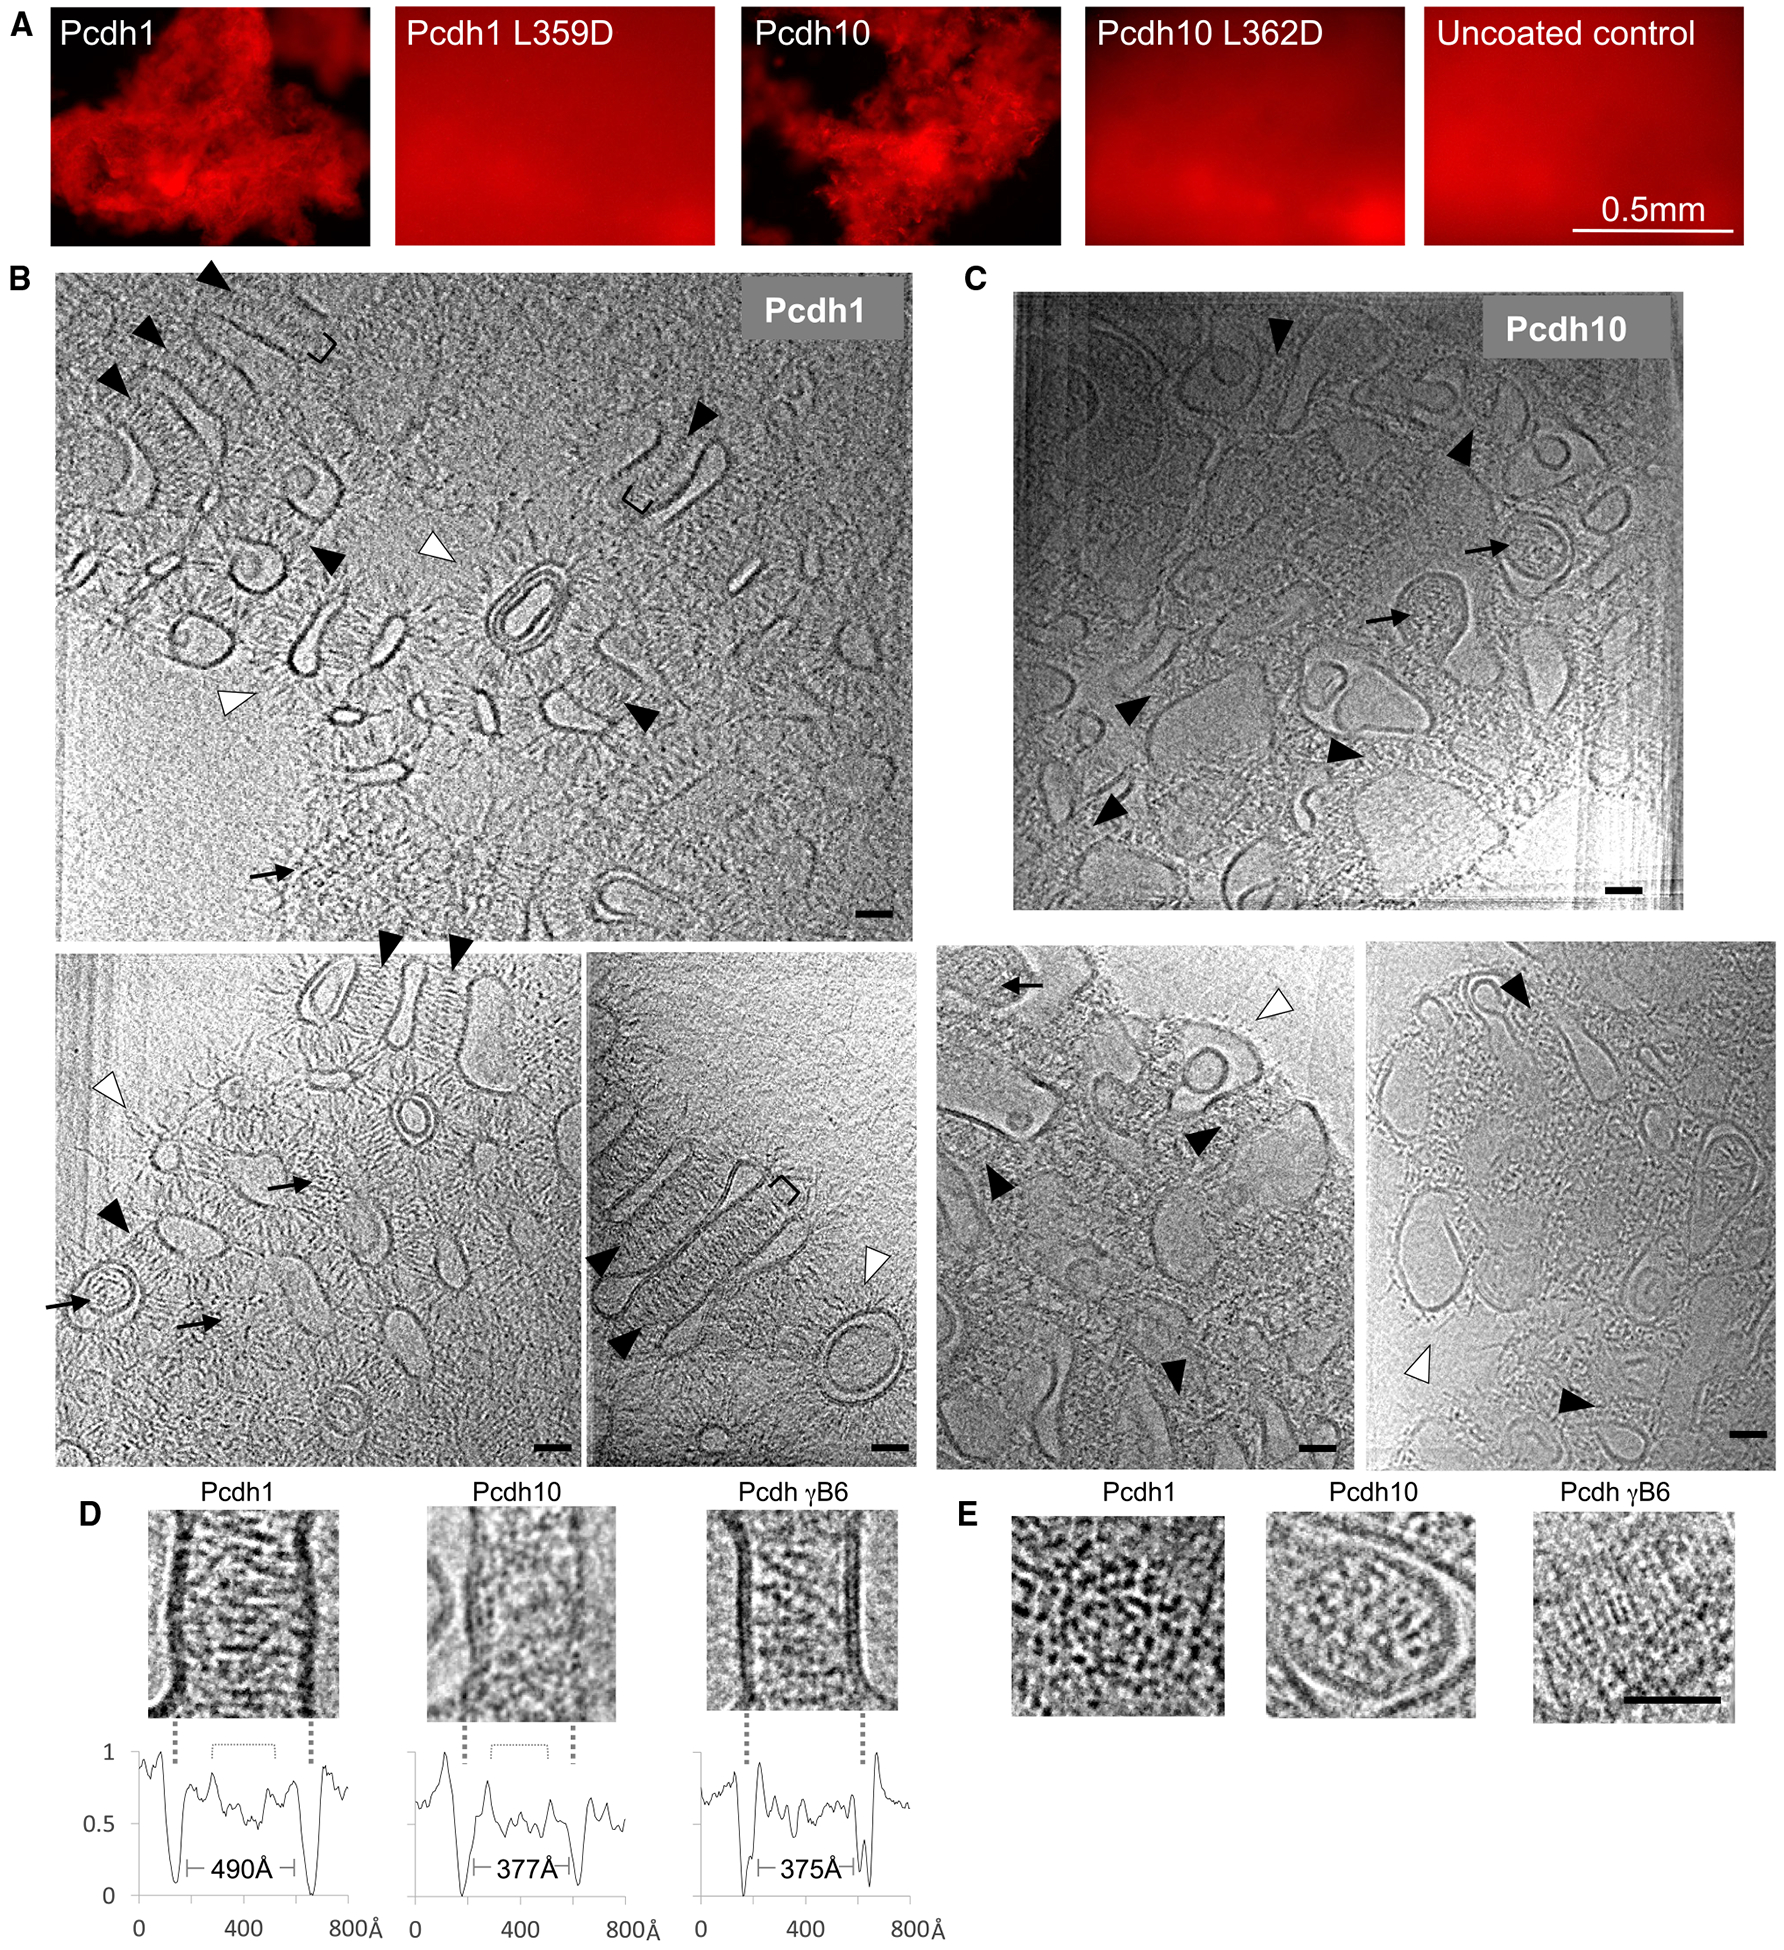
Figure 6. Assembly of δ-protocadherin Ectodomains in Reconstituted Liposome Junctions.

(A) Fluorescence microscopy of liposome aggregation mediated by pcdh1 and pcdh10 ectodomains or trans dimer mutants pcdh1 L359D and pcdh10 L362D. Scale bar: 0.5 mm.
(B and C) Representative slices of reconstructed tomograms showing aggregated liposomes of pcdh1 (B) or pcdh10 (C). Protocadherin ectodomains enrich at liposome contact sites seen in “side views” (black arrowheads) where membranes appear parallel, and “top views” (arrows) where liposomes are stacked vertically. Unbound ectodomains protrude from non-junctional membranes (white arrowheads). See Videos S1, S2, S3, S4, and S5.
(D) Side views of pcdh1, pcdh10, and pcdh gB6 junctions showing ordered assembly only for pcdh gB6. Intensity plots below each image show intermembrane distances and shallow minima where trans dimers overlap (brackets). Lipid bilayers are indicated with dashed lines.
(E) Comparison of top views showing formation of a regular lattice by pcdh gB6 ectodomains only. Scale bars in (B)–(E): 400 Å. See Table S3.
